Provincial and Territorial Energy Profiles – Nunavut
On this page:
Connect/Contact Us
Please send comments, questions, or suggestions to
energy-energie@cer-rec.gc.ca
-
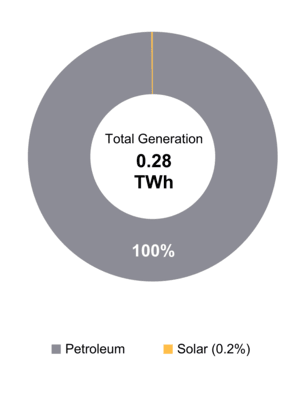
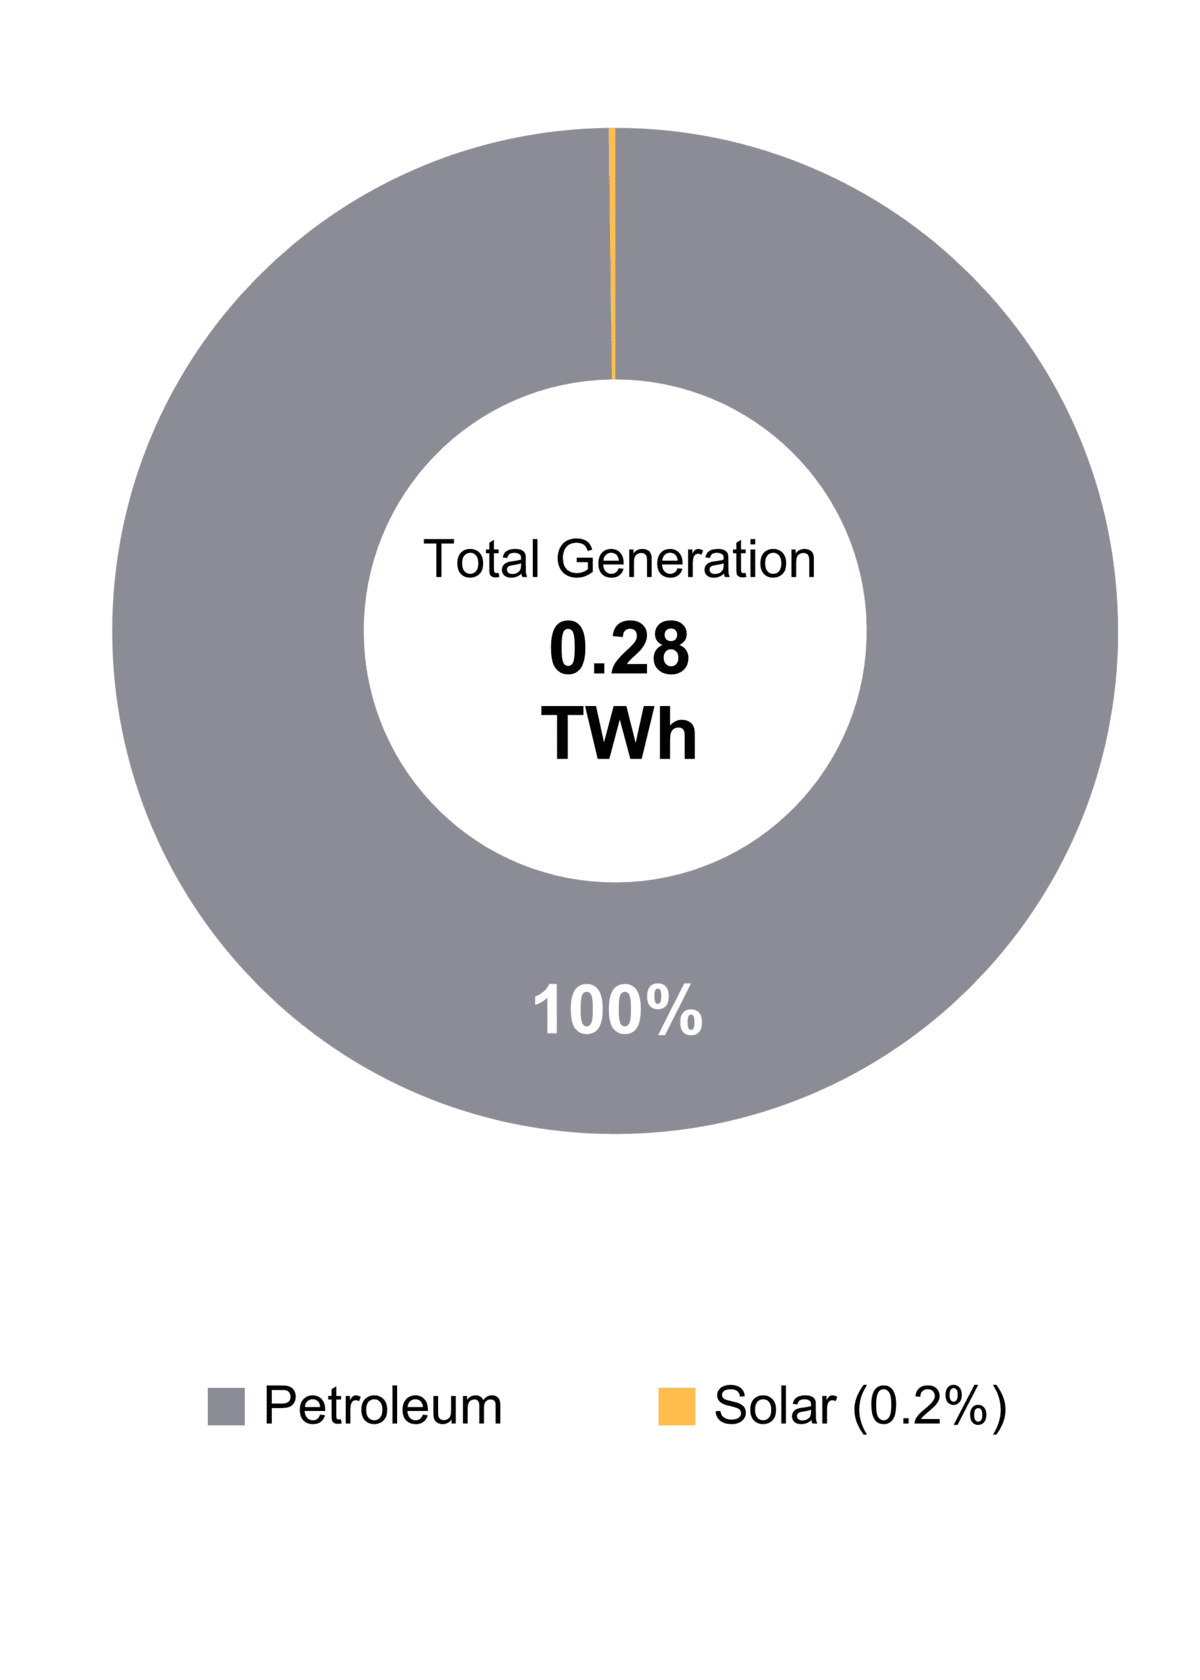
Figure 1: Electricity Generation by Fuel Type (2021)
Source and Description:
Source:
CER – Canada's Energy Future 2023 Data Appendix for Electricity GenerationDescription:
This pie chart shows electricity generation by source in Nunavut. A total of 0.28 TWh of electricity was generated in 2021. -
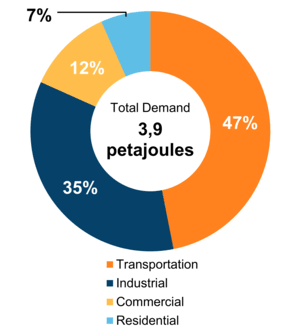
Figure 2: End-Use Demand by Sector (2020)
Source and Description:
Source:
CER – Canada's Energy Future 2023 Data Appendix for End-Use DemandDescription:
This pie chart shows end-use energy demand in Nunavut by sector. Total end-use energy demand was 3.9 PJ in 2020. The largest sector was transportation at 47% of total demand, followed by industrial (at 35%), commercial (at 12%), and lastly, residential (at 7%). -
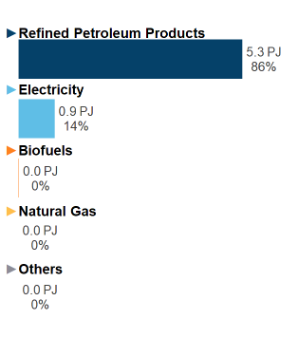
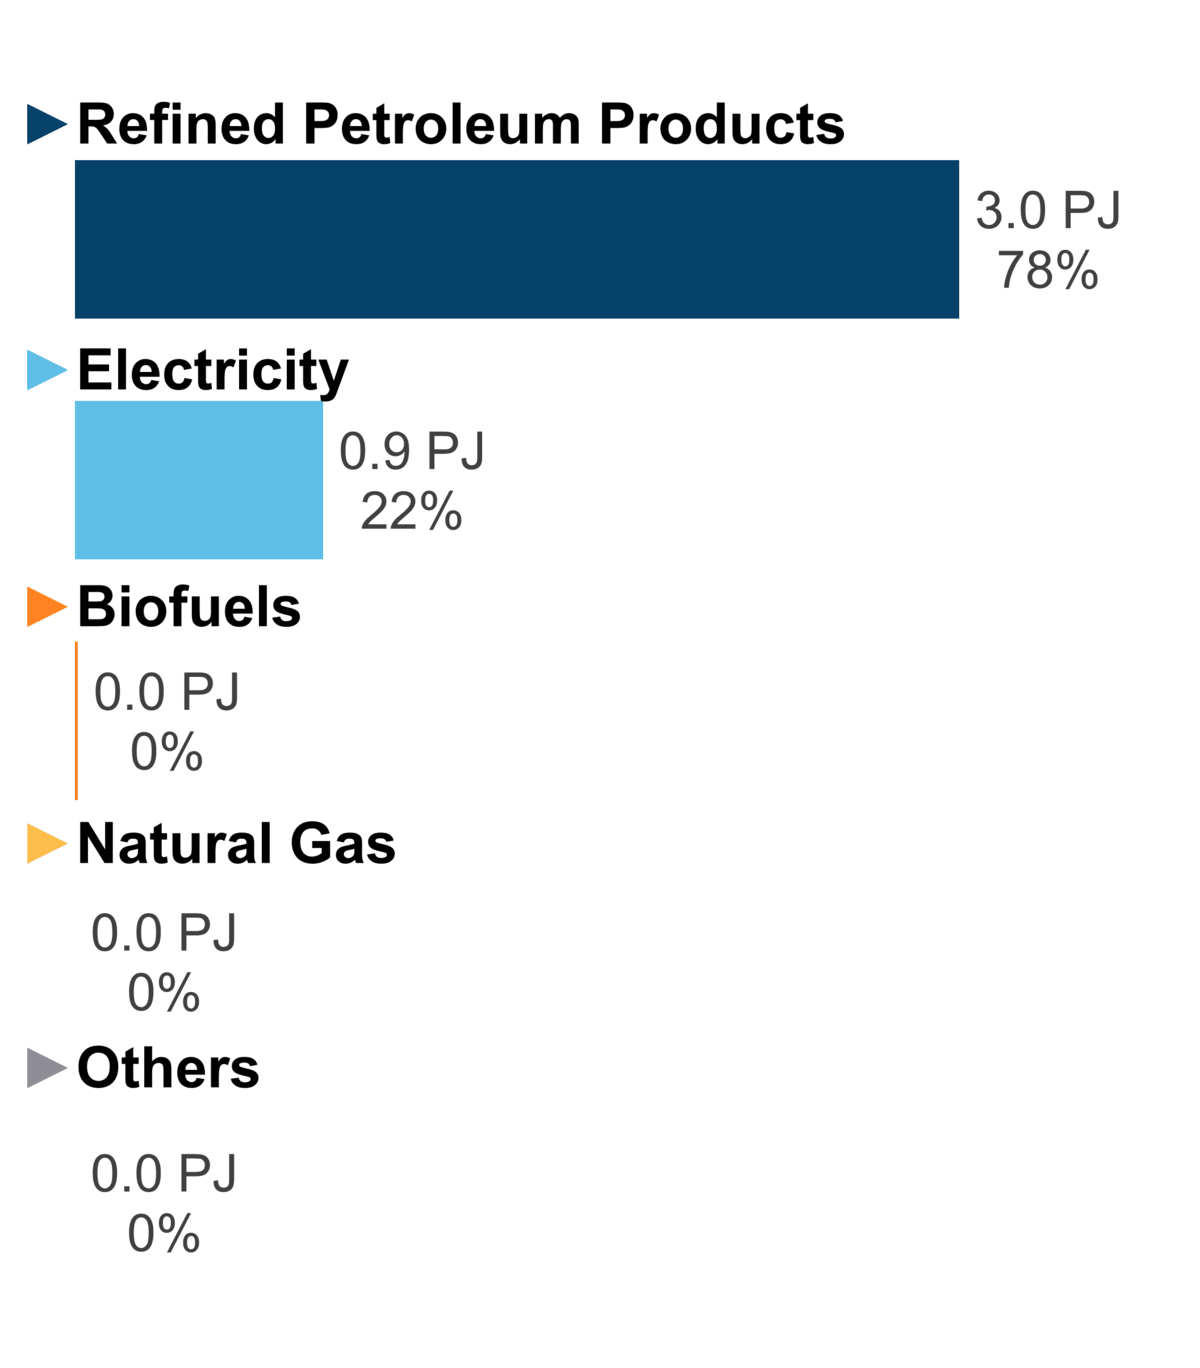
Figure 3: End-Use Demand by Fuel (2020)
Source and Description:
Source:
CER – Canada's Energy Future 2023 Data Appendix for End-Use DemandDescription:
This figure shows end-use demand by fuel type in Nunavut in 2020. Refined petroleum products accounted for 3.0 PJ (78%) of demand, followed by electricity at 0.9 PJ (22%). There was no end-use demand of biofuels, natural gas, or others.
Note: "Other" includes coal, coke, and coke oven gas. -
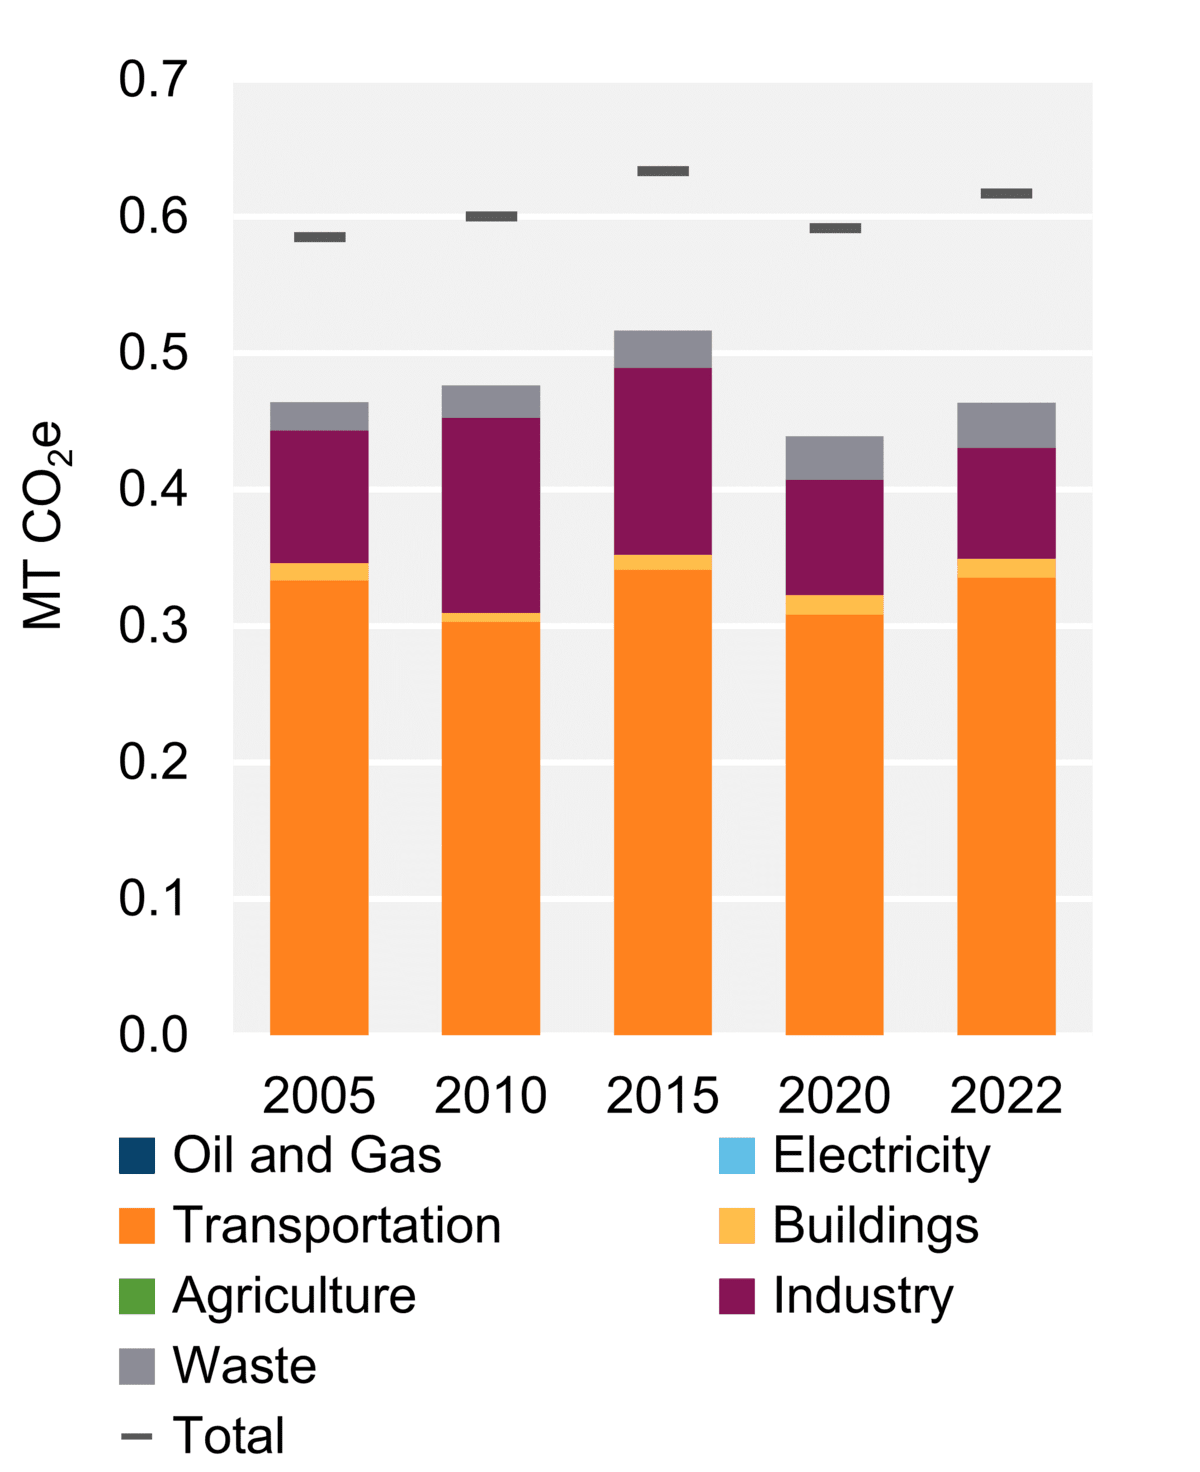
Figure 4: GHG Emissions by Sector

Source and Description:
Source:
Environment and Climate Change Canada – National Inventory Report 1990-2022Description:
This stacked column graph shows GHG emissions in Nunavut by sector from 2005 to 2022 in MT of CO2e. Total GHG emissions have increased in Nunavut from 0.58 MT of CO2e in 2005 to 0.62 MT of CO2e in 2022. -
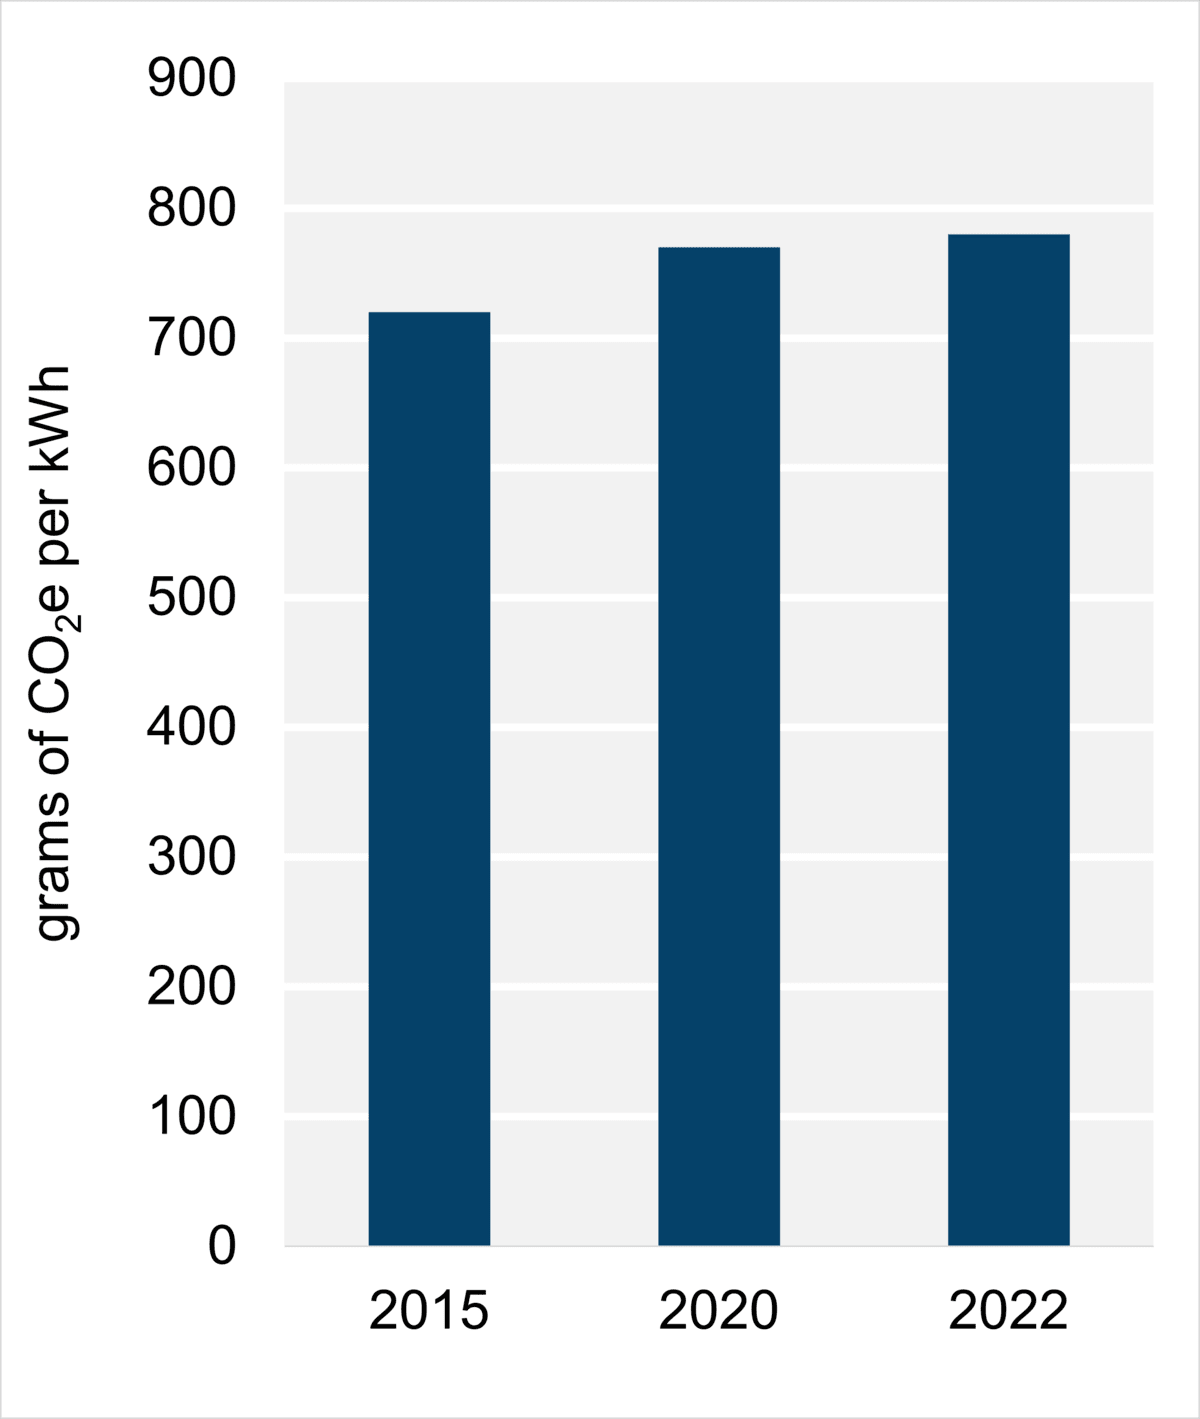
Figure 5: Emissions Intensity from Electricity Generation

Source and Description:
Source:
Environment and Climate Change Canada – National Inventory Report 1990-2022Description:
This column graph shows the emissions intensity of electricity generation in Nunavut from 2015 to 2022. In 2015, electricity generated in Nunavut emitted 720 g of CO2e per kWh. By 2022, emissions intensity increased to 780 g of CO2e per kWh. Data prior to 2015 is suppressed due to statistical limitations.

Energy Production
Crude Oil
- Nunavut does not have any commercial crude oil production.
- Between 1985 and 1996, 3.0 million barrels of crude oil were produced at the Bent Horn field on Cameron Island. The light crude oil produced at Bent Horn was used to power generators at Resolute Bay and the Polaris Zinc Mine.
- In December 2016, the federal government announced that Canadian Arctic offshore, including the federal waters offshore of Nunavut, is indefinitely off limits to new offshore oil and gas licensing, to be reviewed every five years through a climate and marine science-based life-cycle assessment.
- In 2019, the federal government issued an order, expiring at the end of 2021, prohibiting all oil and gas activities in the Canadian Arctic offshore, including activities associated with existing licenses.Footnote 1 This order was most recently amended on 8 December 2023 to extend the expiry date to 31 December 2028.Footnote 2
- In 2023, the “Report of the Committee on the Science-based Assessment of Offshore Oil and Gas Exploration and Development in the Eastern and Central Arctic” was issued.Footnote 3 This report assesses the potential impact from Arctic offshore oil and gas exploration and development, including a detailed analysis of hydrocarbon potential in Nunavut.
- The Nunavut Lands and Resources Devolution Agreement was signed 18 January 2024.Footnote 4 The agreement officially begins the transfer of responsibilities for Nunavut’s public lands, natural resources, and rights in respect of water from the Government of Canada to the Government of Nunavut. This process is expected to take three years, with control being transferred on 1 April 2027 (the Transfer Date). The CER will remain as the regulator for oil and gas activities for at least five years after the Transfer Date. Following that, the CER’s jurisdiction will be renewed for further five-year periods unless the Government of Nunavut establishes a different regulator for petroleum resources.
- Nunavut’s crude oil resources are estimated at 18.3 billion barrels.Footnote 5
Refined Petroleum Products (RPPs)
- There are no refineries in Nunavut.
Natural Gas/Natural Gas Liquids (NGLs)
- There is currently no natural gas or NGL production in Nunavut.
- Nunavut’s natural gas resources are estimated to be 181.4 trillion cubic feet.Footnote 6
Electricity
- In 2021, Nunavut generated around 0.28 terawatt-hours (TWh) of electricity (Figure 1), which is less than 0.05% of total Canadian production. Nunavut has an estimated generating capacity of 62 megawatts (MW).
- Qulliq Energy Corporation (QEC), owned by the Nunavut government, is responsible for generation, transmission, and distribution of electricity in Nunavut. QEC operates 25 diesel plants in 25 communities.Footnote 7 These communities are not connected by roads or power lines and there is no back-up grid.
- Almost all of Nunavut’s electricity is generated from diesel fuel imported during the summer and then stored for year-round use.
- Diesel plants are gradually being replaced with more modern, efficient generators in communities across Nunavut. In 2019, new diesel power plants capable of integrating renewable energy sources were installed in Grise Fiord and Cape Dorset. In 2021, a new diesel power plant was completed in Arctic Bay.Footnote 8 Decommissioning of the old power plant’s fuel system occurred in July 2023.
- QEC’s Corporate Plan for 2022-2026 prioritized the construction of new power plants in Cambridge Bay, Igloolik, and Gjoa Haven between 2023 and 2026 to replace aging generators.Footnote 9 QEC is also seeking approval from the Government of Nunavut to replace generators in Chesterfield Inlet, Kugaaruk, Coral Harbour, Pond Inlet, and Whale Cove.Footnote 10
- In August 2019, the Government of Canada, QEC, and the Mayor of Kugluktuk announced joint funding for Nunavut’s first hybrid solar/diesel power plant, replacing the existing, less efficient, diesel facility built in the late 1960s. The project will include a 500 kilowatt (kW) solar system. Completion of the project was expected in late 2023, but it has faced numerous delays.Footnote 11Footnote 12
- In 2023, five Nunavut communities shared a $4.1 million federal government grant for solar projects. The funding will assist the communities of Arctic Bay, Clyde River, Pond Inlet, Whale Cove, and Grise Fiord with their transition from fossil fuels to renewable energy.
- Solar modules have been installed at the QEC’s power plant in Iqaluit since March 2016, as part of a pilot project. Solar has also been installed at the Arctic Winter Games Arena and Arctic College, both in Iqaluit.
- QEC’s Net Metering ProgramFootnote 13 allows residential and municipal electricity customers to produce their own electricity through small-scale (up to 10 kW) renewable energy sources. These customers can integrate their surplus energy to QEC’s local grid in exchange for credits for future electricity use.
Energy Transportation and Trade
Crude Oil and Liquids
- There are no crude oil pipelines or crude-by-rail facilities in Nunavut.
- RPPs, including gasoline, diesel, and jet fuel, are typically received from the East Coast of Canada, the United States, or in some cases, overseas countries such as Finland or Japan; however, source location may vary from year to year based on product availability.Footnote 14 RPPs are transported to Nunavut from the East Coast of Canada by small marine vessels. RPPs are distributed throughout the territory in the summer when the roads and waterways are accessible.
- Nunavut’s harsh climate, sparse population, small community sizes, and large distance from refining centres results in costly fuel delivery. The territorial government’s Petroleum Products DivisionFootnote 15 is responsible for the purchase, import, storage, and delivery of fuels using private companies or subcontractors.
Natural Gas
- There are no natural gas pipelines in Nunavut.
Liquefied Natural Gas (LNG)
- There are no current or proposed large-scale LNG facilities in Nunavut.
Electricity
- There are no regional or territorial electricity grids in Nunavut. All electricity generation is community based.
- Because of long distances to neighbouring provinces and territories, there are no transmission lines enabling the trade of electricity between Nunavut and other jurisdictions.
- The federal government is supporting studies on the feasibility of the proposed Kivalliq Hydro-Fibre Link Project.Footnote 16 The project includes a 150 MW transmission power line and broadband internet connection from northern Manitoba to communities in Nunavut.
Energy Consumption and Greenhouse Gas (GHG) Emissions
Total Energy Consumption
- End-use demand in Nunavut was 3.9 petajoules (PJ) in 2020. The largest sector for energy demand was transportation at 47% of total demand, followed by industrial at 35%, commercial at 12%, and residential at 7% (Figure 2). Nunavut’s total energy demand was the smallest in Canada, and smallest on a per capita basis.
- RPPs were the largest fuel-type consumed in Nunavut in 2020, accounting for 3.0 PJ, or 78% of total end-use demand. Electricity accounted for the remaining 0.9 PJ (22%) (Figure 3).
Refined Petroleum Products
- Nunavut is the smallest market in Canada for RPPs. Total 2022 demand for RPPs was less than 0.1% of total Canadian RPP demand.
- Nunavut’s motor gasoline demand in 2022 was 565 litres per capita, 45% below the national average of 1,035 litres per capita.
- Nunavut’s diesel demand in 2022 was 1,056 litres per capita, 37% above the national average of 772 litres per capita.
- A significant portion of Nunavut’s demand for diesel fuel is for power generation. Virtually all of Nunavut’s installed electricity generation capacity is diesel-fueled.
- Gasoline and diesel (for vehicle use and space heating) prices are set by the territorial government on an annual basis. Prices differ across regions based on factors such as the supply and delivery cost.Footnote 17
Natural Gas
- No natural gas is used in Nunavut.
Electricity
- In 2020, annual electricity consumption per capita in Nunavut was 6.03 megawatt-hours (MWh). Nunavut ranked the lowest in Canada for per capita electricity consumption and consumed 58% less than the national average.
- Nunavut’s largest sectors for electricity consumption in 2020 were commercial at 0.11 TWh, residential at 0.07 TWh, and industrial at 0.06 TWh.
- Nunavut has one of the highest prices for electricity in Canada. Nunavut’s low population density and dispersed communities lacking access to the North American bulk electricity or natural gas grids result in the need to import high-cost diesel to generate electricity. Residential electricity rates are generally subsidized, up to a monthly usage threshold, to equalize rates across the territory.
GHG Emissions
- Nunavut’s GHG emissions in 2022 were 0.62 megatonnes of carbon dioxide equivalent (MT CO2e).Footnote 18 Nunavut’s GHG emissions have increased 5% since 2005.
- Nunavut’s emissions per capita are 15.2 tonnes CO2e. That is 16% below the Canadian average of 18.2 tonnes per capita.
- The largest emitting sector in Nunavut is transportation at 54% of emissions (Figure 4).
- In 2022, Nunavut’s power sector emitted 0.15 MT CO2e emissions, which represents about 0.3% of Canadian emissions from power generation.
- The greenhouse gas intensity of electricity generation in Nunavut, measured as the GHGs emitted in the generation of electricity in the territory, was 780 grams of CO2e per kilowatt-hour (g CO2e/kWh) electricity generated in 2022. The national average in 2022 was 100 g CO2e/kWh (Figure 5).
Energy Authorities
- Government of Nunavut: Petroleum Products Division
- Nunavut Energy Management Program
- Qulliq Energy Corporation
- Nunavut Climate Change Secretariat
- CER–Canada’s Renewable Power: Nunavut
- Date modified: