Back to Main

Towards Net-Zero


Overview of Net-Zero

Canada has recently announced more ambitious climate commitments, including exceeding 2030 emission targets and achieving net-zero emissions by 2050. Internationally, momentum towards climate action continues to accelerate, reinforcing the global commitment made in the 2015 Paris Agreement to reach net-zero in the second half of the century.27 Canada’s plan to achieve net-zero emissions by 2050, still under development, will set legally-binding, five year emissions reduction milestones, based on the advice of experts and consultations with Canadians.28

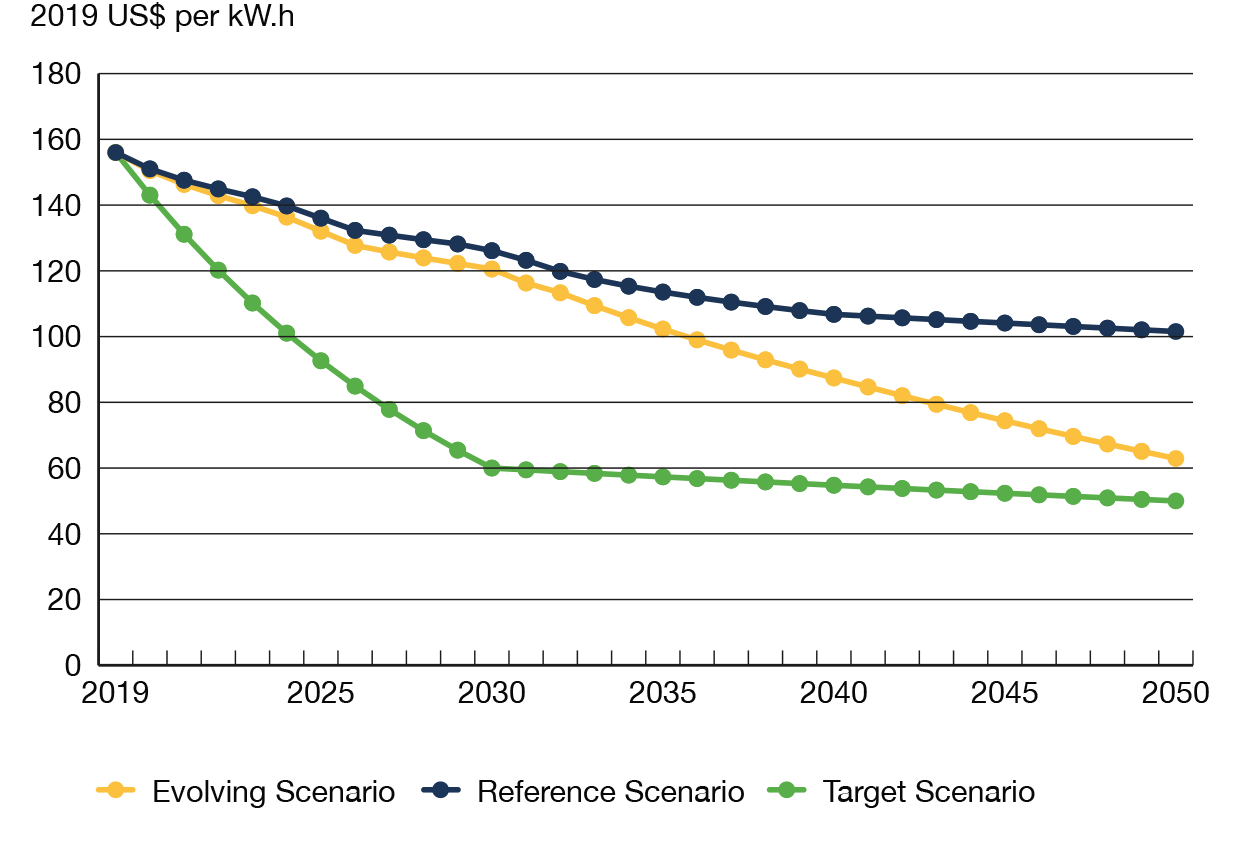
The Evolving Scenario projections in the “Results” section show significant change across the energy system. These changes reflect the core premise of the scenario – climate action continues to develop as Canada keeps with global efforts to proceed towards energy transition. Even though the Evolving Scenario shows a very different energy system than today’s, fossil fuels still make up a majority of Canada’s energy mix by 2050, and are not fully decoupled from emissions via technologies such as carbon capture, utilization and storage (CCUS).

Given that the Evolving Scenario continues the recent pace of change in Canada’s energy transition, the continued reliance on fossil fuels is an important insight. For Canada to meet its 2050 goals, the rate of energy transition will need to increase beyond levels shown in the Evolving Scenario. This section discusses the implications of going beyond the Evolving Scenario, and moving the energy system towards net-zero emissions. Frist we look at what net-zero means. Then, to gain insight into what a net-zero energy transition might mean for different parts of the economy, we focus on three diverse segments of Canada’s energy system: personal passenger transportation, oil sands production, and remote and northern communities. For each segment, we explore its current status, considerations for the segment in the energy transition, and potential pathways and uncertainties in moving towards net-zero.

What is Net-Zero?

“Net-zero” GHG emissions, or “carbon neutrality”, refers to the balance of human-caused GHG emissions and removals from the atmosphere. Reaching net-zero emissions does not necessarily require eliminating all emissions everywhere. Instead, residual emissions can be balanced by enhancing biological sinks and negative emission technologies. For more information, see the “Greenhouse Gas Removal” textbox.

Figure NZ.1 provides a hypothetical illustration of net GHG emissions over time, with net emissions of zero in 2050. In this illustration, the level of emission reductions relative to a post-2020 business-as-usual baseline (“mitigation”) increases over time, as negative emission technologies are increasingly developed and commercialized, and biological sinks are enhanced.

Recent reports, including the Intergovernmental Panel on Climate Change’s (IPCC’s) special report, Global Warming of 1.5°C, indicate that achieving economy wide net-zero GHG emissions is likely required to stabilize global average surface temperatures at a level needed to avoid the worst impacts of climate change. This includes emissions from land use, agriculture, and industrial production, in addition to the energy system. International climate targets, such as limiting global temperature increase to well below 2°C, likely require an energy system with net-zero (or even net-negative) emissions later this century.29 Net-zero emissions targets are a useful focal point for linking global temperature targets to their implications for Canada’s energy system transformation.

Figure NZ.1: Illustrative Example, the GHG Emission Balance Remaining after Mitigation and Emissions Removal Figure NZ1 Illustrative Example, the GHG Emission Balance Remaining after Mitigation and Emissions Removal
Description

This graph shows a conceptual illustration of a net-zero greenhouse gas transition from 2010 to 2050. These years are shown on the horizontal axis, while the vertical axis shows greenhouse gas emissions with positive emissions above the horizontal axis and negative emissions below. There are three areas, and two lines on the chart, each representing greenhouse gas emissions trajectories over time. First, the chart shows a line representing business-as-usual emissions from 2020 onward maintaining historic levels. Second, it shows two areas representing GHG mitigation and remaining emissions, respectively. The graph shows a third area below the horizontal axis representing emissions removals increasing into the future. Finally, the graph shows a net emissions line that declines from present levels to zero GHGs by 2050.

  • Business-As-Usual Emissions Trend. Represents a hypothetical GHG emissions trajectory where future GHG reductions are not pursued.

  • Mitigation. Represents GHG emissions reductions relative to the business-as-usual trajectory.

  • Remaining Emissions. GHG emissions remaining after mitigation.

  • Emission Removals. GHGs removed via negative emission technologies or enhanced biological sinks.

  • Net Emissions. The balance of remaining emissions and emission removals.


What Does It Involve?

What the exact 2050 balance might be between removing and emitting GHGs into the atmosphere is not yet clear.30 The specific energy-using technologies, and their role within the economy is uncertain, as is their overall emissions profile. Recycling, and removing carbon from the atmosphere will be important activities. However, the extent to which biological sinks will be enhanced, and negative emissions technologies deployed is unclear, and currently challenged by high perceived risk and market uncertainties.31

What is clear is that Canada’s likelihood of achieving our ambitious net-zero target increases as our energy system emissions fall. Over 80% of Canada’s GHG emissions are currently associated with the energy system. Given the diversity of Canada’s current and historical energy and emissions profile, deep reductions in emissions will likely need to be achieved across Canada’s energy system and economy to achieve net-zero emissions. Figure NZ.2 compares historical emission levels to hypothetical 30%, 60% and 90% reduction levels, illustrating the large difference between current levels and significant reductions that could be needed to reach net-zero, based on recent research.32

Figure NZ.2a: Historical Canadian GHG Emissions Compared to Implied 30%, 60%, and 90% Reductions, by Sector (a), and Per Capita (b)
a) Total Emissions by Sector
Figure NZ2 Historical Canadian GHG Emissions Compared to Implied 30%, 60%, and 90% Reductions, by Sector (a), and Per Capita (b)
Figure NZ.2b: Historical Canadian GHG Emissions Compared to Implied 30%, 60%, and 90% Reductions, by Sector (a), and Per Capita (b)
b) Emissions per Capita
Figure NZ2 Historical Canadian GHG Emissions Compared to Implied 30%, 60%, and 90% Reductions, by Sector (a), and Per Capita (b)
Description

This figure compares historical emission levels to hypothetical 30%, 60% and 90% reduction levels from 2005, illustrating the large difference between current levels and significant reductions that could be needed to reach net-zero, based on recent research. Figure (a) shows total emissions broken down by sector for 1990 (603 MT), 2005 (730 MT) and 2018 (729 MT).

Figure (b) shows emissions per person for 1990 (12.8 tonnes per person), 2005 (22.6 tonnes per person), and 2018 (19.7 tonnes per person).

To substantially decrease energy system emissions, several complementary dynamics will likely play a large role. Increasing the share of zero and low carbon energy sources, such as low carbon electricity, used across the entire economy will be key, as will the contributions from existing trends in energy efficiency.33 Even with considerable improvements in energy conservation and efficiency, research suggests shifting away from burning fossil fuels for energy and replacing them with low carbon alternatives will be crucial to long-term deep decarbonization of the Canadian economy.34

Some energy uses, like passenger transportation, might be relatively straightforward to decarbonize economically by 2050. Other energy uses carry with them emissions that are unlikely to be fully eliminated, such as energy used for steel and cement production. It is the emissions that are likely to remain even after significant mitigation efforts that highlight the potential role to be played by GHG emissions removal.

Greenhouse Gas Removal

Negative emissions technologies and enhanced biological sinks involve removing CO2 from both the emissions’ source, and the atmosphere, and storing it in land, ocean, or geological reservoirs.1 While hypothetically promising, most assessments agree that negative emissions technologies, in particular, are not a replacement for conventional mitigation and adaptation methods, due to the high costs, potential for risks, and uncertainties involved.2 Significant uptake of negative emissions technologies could require increased demand of low carbon energy, like electricity and sustainable biomass, for their operation. This is an important consideration for a future net-zero energy system.

Notable GHG removal methods include:

  • Reforestation and afforestation:3 Carbon can be sequestered in biomass through restocking of existing forests and woodlands that have been depleted, or introducing trees to areas that have not previously been forested.

  • Soil carbon sequestration:4 Carbon can be removed from the atmosphere and stored in the soil carbon pool, primarily in the form of soil organic carbon. This can be accomplished through a variety of methods, including the restoration of degraded soils or widespread adoption of soil conservation practices in agriculture. For instance, reducing soil carbon loss can be achieved in certain circumstances by switching from tillage to no-till cropping.

  • Bio-energy with carbon capture and storage (BECCS):5 Carbon can be captured and stored by geological sequestration or land application, as energy is extracted from biomass through combustion, fermentation, or other conversion methods. Limiting factors for BECCS include the availability and sustainability of feedstock biomass, and the availability of storage capacity.

  • Direct air capture (DAC): Carbon can be captured via thermochemical processes at atmospheric concentrations (as opposed to from point sources) to produce a concentrated stream of CO2. It can then be sequestered (resulting in emission removals), or used to make carbon neutral synthetic fuels. DAC is energy-intensive, so its net effect on emissions largely depends on the carbon intensity of its fuel.

  • (1) IPCC AR5 – Assessing Transformation Pathways.
  • (2) IPCC AR5 – Assessing Transformation Pathways.
  • (3) IPCC AR5 – Agriculture, Forestry and Other Land Use.
  • (4) IPCC AR5 – Agriculture, Forestry and Other Land Use.
  • (5) For a review of BECCS and DAC research, see section 6.9 of IPCC AR5 - Assessing Transformation Pathways.


Looking Ahead

It is clear that Canada will need a combination of low carbon fuel switching and energy efficiency going forward, but the precise mix is uncertain. Reaching net-zero targets will require considerable emissions reduction as well as GHG emissions removal.

The remainder of this section explores the implications of moving towards net-zero for three segments of Canada’s energy system: personal passenger transportation, oil sands production, and remote and northern communities. These areas present a diverse range of challenges and opportunities in the shift towards a net-zero energy system. Exploring these three segments provides insights into what a net-zero energy transition might mean for different parts of the energy system.

Exploring these specific segments yields some key insights:

  • Continued low carbon technology development will be essential to achieving 2050 goals. Our analysis of all three segments discusses many potential technologies that could help reduce emissions to varying degrees. In a net-zero energy system, the equipment and processes used to provide energy will look much different than today. The rate at which the economics can improve for technologies such as zero emission vehicles, low carbon oil sands production processes, and reliable low carbon energy for remote communities is a key factor that will shape Canada’s evolution towards its 2050 goals. Most of these technologies will involve a reduction in the use of fossil fuels, and/or an increase in low or non-emitting energy sources.

  • Policies will be a key driver of change. Government policies will play a key role in providing incentives for these necessary technology developments and adoptions to occur. Without policy signals that provide a requirement, or value for reducing and/or eliminating GHG emissions, the required changes are unlikely to be made. While policies will be a key driver of change, other factors could play important roles. These include consumer preferences, investor and ESG considerations, domestic and global energy market developments, and unique regional concerns. Effective policies will need to account for these considerations.

  • The evolution of each segment of the energy system will depend on its specific circumstances, as well as broader domestic and international trends. We have analysed three segments of Canada’s energy system in relative isolation. However, each of these segments depend heavily on many other factors beyond their own energy consumption and production processes. In the case of oil sands production, global energy supply and demand trends that set market prices will be critical in its future. For personal passenger transportation, consumer tastes and preferences, as well as the development of a global market for ZEVs, will help determine the future vehicle mix and energy use. Remote and northern communities highlight many key social and environmental issues, such as local air quality, and energy reliability and affordability, as key considerations in the energy transition.

Highlights from Focus Areas

Personal Passenger Transportation

  • Future transportation trends will be influenced by the interaction of technology costs, consumer preferences, and policies.

  • Considering the dominant role of oil products in transportation today, the Evolving Scenario shows a very significant shift in personal transportation – with about half of new personal vehicles sold in 2050 being ZEVs. If ZEV costs fall faster, the penetration rates are even higher.

Oil Sands Production

  • There are a variety of emerging technological solutions to reduce emissions in oil sands production.

  • The broader market for crude oil, including demand for oil products and market price impacts, and the relative competitiveness of the oil sands, will be key factors in determining whether investments in these technological solutions are made.

  • ESG considerations could have an increasing role in the deployment of emissions reduction technologies in the oil sands.

Remote and Northern Communities

  • Remote and northern communities have unique energy systems, with a higher reliance on RPPs, such as diesel, compared to the rest of Canada.

  • Many of the technology improvements in the broader energy system, such as improved efficiency and falling costs of renewable energy, could help these communities transform their energy systems. However, their specific needs and considerations will influence how these changes can be adopted.

  • Remote and northern communities are diverse. High energy costs, limited transportation access, cold climates, local air quality, and maintaining reliability without being connected to North American electric or natural gas grids, are just some of the relevant issues in these communities. GHG reduction options will need to reflect this diversity and these issues.

Back to Top

Personal Passenger Transportation


Energy Profile of On-road Vehicle Passenger Transportation

The transportation sector is a major source of energy demand in Canada and is comprised of multiple subsectors. These include passenger, freight, marine, and air transportation. This section focuses on on-road vehicle passenger transportation.

In 2018, energy use in the transportation sector totaled 2 840 PJ, which accounts for almost 23% of all energy consumed in Canada. Of this amount, non-aviation passenger transportation accounted for 1 170 PJ, or 41% of all transportation energy use. Of this, 95% was from fossil fuels, almost all of which was gasoline. Given the large amount of fossil fuels consumed by the sector, reaching net-zero emission represents a major change.

In the EF2020 Evolving Scenario, passenger transportation undergoes a significant shift. The share of biofuels blended in gasoline and diesel increases, fuel economy improves, and in the long-term EVs take up a significant share of total vehicle sales. However, as shown in the previous chapter, while fossil fuels decline in the transportation sector, they still account for a significant share in 2050. This section explores the potential for even greater change in the transportation sector in the context of Canada achieving net-zero emissions by 2050. We focus specifically on personal vehicle transportation and the transition from conventional fossil fuel vehicles towards EVs.

Figure PT.1: Share of Total Canadian SUV Sales are Increasing While Cars are Decreasing Figure PT1 Share of Total Canadian SUV Sales are Increasing While Cars are Decreasing
Description

This chart breaks down vehicle sales by vehicle type from 2011 to 2018. Car sales decreased from 42% of sales in 2011 to 30% in 2018. SUV sales increased from 33% in 2011 to 45% in 2018. Lastly, truck sales remained relatively flat at 25% from 2011 to 2018.

Figure PT.2: Assumed Battery Costs Decline Faster in the Evolving Scenario vs the Reference Scenario Figure PT2 Assumed Battery Costs Decline Faster in the Evolving Scenario vs the Reference Scenario
Description

This chart breaks down battery cost declines throughout the projection period. In the Evolving Scenario, battery costs decline from $156/kWh in 2019 to $63/kWh in 2050, compared to $101/kWh in the Reference Scenario. In the Target Scenario, battery costs decline rapidly to $60/kWh by 2030 and $50/kWh by 2050.


Considerations for the Energy Transition

Many factors have influenced, and will continue to influence, energy use trends related to personal passenger vehicle choices. Here are some of the key considerations:

  • Consumer preferences: Increasingly, Canadians are purchasing larger vehicles like sports utility vehicles (SUVs) and trucks. Figure PT.1 plots the market shares of cars, trucks, and SUVs. Since 2011, the market share of SUVs has grown rapidly, from about 58% in 2011 to 70% in 2018. At the same time, the share of cars has fallen from 42% to 30%. It should also be noted that this breakdown varies between provinces. For example in Saskatchewan SUV and truck sales made up 85% of new sales, while in Quebec the share was lower at 60%. The breakdown of vehicle types is an important variable when modelling the adoption of ZEVs. In 2018, almost 2.5% of all vehicle sales were ZEVs. However, within the ZEV category, sales were predominantly made up of cars, comprising 77% of ZEV sales in 2018. This disparity is due to the differences in the selection and costs of ZEV cars and SUVs. The market for ZEV cars is better established, relative to SUVs, and the market for ZEV trucks is non-existent to date.

  • Policies: Many policies can influence transportation energy trends.35 These include vehicle fuel economy standards, biofuel blending requirements, low carbon and clean fuel standards, and ZEV mandates. The Canadian federal government provides subsidies for EV purchases and is investing in charging infrastructure. It also has a target of 100% of Canada’s vehicle sales being ZEVs by 2040, which – like other targets – is not explicitly modeled in the Evolving or Reference Scenarios. Achieving that target is modeled here in a separate scenario, the 2040 Target Scenario.

  • Technology: EV battery costs are assumed to fall significantly in both the Evolving and Reference Scenarios (Figure PT.2). Continued cost reductions are uncertain and could be greater,36 or less37 than shown in the Evolving Scenario. The ultimate reduction in battery costs will be a key factor in making EVs a competitive option in the personal vehicle market. Another key factor is the type of ZEVs available. As mentioned above, the selection of ZEVs on the market is dominated by cars. However, the market for ZEV trucks and SUVs is expected to grow rapidly in the coming years with auto manufacturers bringing a wider selection of ZEVs to market. The development of ZEV vehicle range as well as charging speed and availability, are additional factors that could impact future adoption.

  • Alternatives to personal transportation: Alternatives to personal transportation could also play a key role in decarbonizing transportation. This includes public transportation, reduced travel through increased digital communication, and changing transportation infrastructures to those that are more conducive to other non-vehicle travel options, like walking or cycling.

  • Vehicle stock: The vehicle stock represents the total number of registered vehicles on the road. Over time as vehicles reach the end of their useful lives, they are removed from the stock, while new vehicles sold are added to the stock. ZEVs require less maintenance relative to internal combustion engine (ICE) vehicles and are expected to have longer lifespans. ZEVs are assumed to have an average lifespan of 17 years, relative to 12 years for ICE vehicles.38 Since vehicles remain on the road for many years, even if the sales share of ZEVs were to reach 100%, it would still take some time for the stock of ICE vehicles on the road to retire.


Potential Pathways for Deep Decarbonization

To further explore deeper decarbonization of passenger transportation, we will complement the Evolving and Reference scenarios with an additional sector specific scenario: the 2040 Target Scenario. This scenario explores the vehicle sales and stock dynamics of meeting the government’s 2040 target of 100% light-duty vehicle sales39 being ZEVs. While many factors could influence increased ZEV uptake, we model the target scenario by assuming more aggressive battery cost declines. Analysis for the 2040 Target Scenario only extends to personal vehicle sales and stocks, as discussed in this section. We have not modeled this scenario for the energy system at large.

The results of the three scenarios are shown in Figure PT.3. The figures on the left compare the share of ZEV vs ICE vehicles in total Canadian sales. The figures on the right show how these sales figures translate into total vehicle stock. Each year, new sales are added to total vehicle stock, and vehicles that reach the end of their operational life are retired.

Differing battery cost assumptions drive very different outcomes for sales and stock of ZEV vehicles. There is a significant disparity between the Reference Scenario, which assumes only moderate battery cost reductions and no new policies, the Evolving Scenario, and the 2040 Target Scenario. As costs of ZEVs fall in the Evolving and 2040 Target Scenarios, ZEV adoption increases. While other factors, such as policies, could affect ZEV adoption, the relative cost of ZEVs and ICE vehicles will play an important role in the transformation of passenger transportation in Canada. The “Key Uncertainties: Passenger Transportation” section covers additional uncertainties.

Key Uncertainties: Personal Passenger Transportation

  • Technology costs and development: A key factor in the cost of ZEVs is the cost of producing battery packs. The assumed battery production costs are shown in Figure PT.2. Realized production costs may be much higher, or lower, in the future, which could lead to very different rates of adoption of ZEVs. The potential for autonomous/connected vehicles could also impact future vehicle ownership, travel, and energy use trends.

  • Energy costs: The cost of energy, both for gasoline and electricity, will influence the attractiveness of ZEVs relative to ICE vehicles. Future relative costs of gasoline and electricity could be different from the projected costs used in EF2020. For example, growing electrification of transportation globally could put downward pressure on crude oil prices, which in turn could make ICE vehicles more competitive.

  • Consumer preferences: There are many factors beyond the cost of vehicles that drive consumer purchasing decisions. There are intangible factors that affect the purchase decision-making process. For example, in the case of ZEVs, unfamiliarity with new technology may make consumers hesitant to purchase them, even if they have a lower cost of driving. The trend towards purchasing fewer cars and more SUVs is another example. These preferences could also lead to outcomes much different from those discussed here.

  • Alternatives to personal transportation: Zero emissions public transportation, powered by electricity or hydrogen, could play an increasing role in a decarbonized transportation sector. Likewise, reduced demand for personal vehicles via increased walking, cycling, or digital communication could influence the number of ZEVs required. Ride sharing technologies using electric vehicles is another factor which adds uncertainty to the decarbonization of the transport sector.

Figure PT.3: Sales and Stock Trends by Scenario, ZEV vs ICE Personal Vehicles Figure PT3 Sales and Stock Trends by Scenario, ZEV vs ICE Personal Vehicles
Description

These charts break down vehicle sales and stock by vehicle type, for each scenario.

In the Evolving Scenario, ZEV sales increase from 28 678 in 2019 to 1 283,456 in 2050. This increase results in ZEV stock increasing from 127 026 vehicles in 2019, to 10 927,117 by 2050. In the Evolving Scenario, ICE sales decrease from 1 950 602 in 2019 to 1 206 068 in 2050. This decrease results in ICE stock decreasing from 23 385 965 vehicles in 2019, to 22 236 571 by 2050.

In the Reference Scenario, ZEV sales increase from 46 090 in 2019 to 480 714 in 2050. This increases results in ZEV stock increasing from 129 113 vehicles in 2019, to 4 783 862 by 2050. In the Reference Scenario, ICE sales increase from 129 113 in 2019 to 4 783 862 in 2050. This increase results in ICE stock increasing from 23 383 862 vehicles in 2019, to 28 217 744 by 2050.

In the Target Scenario, ZEV sales increase from 32 807 in 2019 to 2 487 111 in 2050. This increases results in ZEV stock increasing from 131 336 vehicles in 2019, to 38 897 053 by 2050. In the Target Scenario, ICE sales decrease from 1 946 471 in 2019 to 2 413 in 2050. This decrease results in ICE stock decreasing from 23 381 835 vehicles in 2019 to 0 by 2050.

Modeling ZEV Adoption in Various Scenarios

In all scenarios, the market share of each vehicle type is a function of the levelized cost1 of driving (LCOD) of that respective vehicle type. The LCOD is a metric which represents a full cost accounting of vehicle ownership on a per kilometer basis. It is a function of many different costs related to owning and operating a vehicle, including purchase price, fuel cost, maintenance, fuel efficiency, kilometers driven and discount rate. The relative differences in the LCOD of different vehicle types drive the differences in market shares over the projection period.

While the LCOD varies by province, the Evolving Scenario ZEV LCOD is approximately 10% lower in 2050 compared to the Reference Scenario, while the 2040 Target Scenario LCOD is 26% lower than the Reference Scenario. These differences are mainly driven by the assumed battery costs shown in Figure PT.2. As the LCOD of ZEV improves relative to ICE vehicles, the ZEV market share increases. In the Evolving Scenario, the LCOD of ZEVs begin to reach parity with ICE vehicles in the mid-2030s, leading to the rapid adoption of ZEVs. In addition to sales, the vehicle stock is also projected forward, and is shown in Figure PT.3. Note that the ZEV share of the total vehicle stock is much lower than the ZEV share of sales. This highlights the fact that it takes time for the vehicle stock to turnover.2

The 2040 Target Scenario takes the same modelling approach as the other scenarios. However, in order to meet the 2040 government target, it assumes more aggressive battery cost declines, as shown in Figure PT.2. Earlier and faster reductions in battery costs are the driver of accelerated ZEV adoption in this scenario. If battery costs do not decline as aggressively, it is still possible for other policy levers to be used to drive ZEV adoption. For example, higher carbon prices3 and policies such as the proposed federal Clean Fuel Standard could be used to improve the economics of ZEVs and incent their adoption.

  • (1) IPCC AR5 – Assessing Transformation Pathways.
  • (2) IPCC AR5 – Assessing Transformation Pathways.
  • (3) IPCC AR5 – Agriculture, Forestry and Other Land Use.
Back to Top

Oil Sands Production


Energy Profile of Oil Sands Production

In 2019, Canada was the fourth largest producer of oil in the world, responsible for over 5% of global output. It holds the third largest proven reserves at 169 billion barrels. The oil sands were responsible for 63% of total Canadian production in 2019, over 3 MMb/d, and comprises 96% of its reserves.

There are three different types of oil sands production. Each production and processing method requires different energy sources, resulting in varying amounts of GHG emissions.

  • Mining and upgrading: Oil sands mining relies on diesel to fuel heavy machinery and equipment that extracts oil sands ore and transports it to processing facilities. Oil sands mines also have cogeneration facilities to produce the energy (heat) required for the mining, bitumen extraction and upgrading processes, and the electricity used to run the operation. The cogeneration units use natural gas or petroleum coke – a by-product of upgrading bitumen into synthetic crude oil (SCO). Similarly, the process through which bitumen is extracted from the mined oil sands ore, as well as upgrading, requires natural gas or petroleum coke to produce steam for heat and to generate the hydrogen needed to upgrade heavier oil into lighter SCO.

  • Standalone mining: In 2013, the first standalone mine, Imperial Oil’s Kearl mine, commenced operation, followed by Suncor’s Fort Hills mine in 2017. The process for this new type of mine creates a diluted bitumen40 that is sent to market without being upgraded. Many of the same emissions sources as in other types of mining are in play here but without any emissions associated with upgrading.

  • In situ: In situ projects rely on a constant supply of steam to maintain steam-assisted gravity drainage (SAGD) and cyclic steam stimulation production operations. Industrial boilers combust natural gas to create this steam from water, which then heats underground reservoirs and mobilizes bitumen for extraction, similar to how conventional oil is pumped to the surface.

Key characteristics of oil sands production that differentiate it from many other forms of oil production:

  • Long-lived with low decline rates: Conventional oil production, and in particular shale oil, can have annual decline rates of over 50% in the first year. This means that wells need to be drilled to keep production levels constant, and even more to wells to grow production. In comparison, the oil sands have a near-zero decline rate with only modest reinvestment. A typical oil sands operation can likely operate for 40-50 years in the case of mines, and 20-40 years in the case of in situ operations. The lives of these assets can be extended beyond these timelines if economic conditions are favourable.

  • Capital intensive: Though costs in the oil sands have declined considerably over the last decade, these operations are still capital intensive and require large upfront investment. In general, higher commodity prices are required to incent a company to build new oil sands production capacity, while expansions to existing facilities can be economic at lower prices. For instance, much of the growth projected for the oil sands in the Evolving Scenario will come from expansions to existing in situ facilities. These operations require a WTI  price of roughly US$45/bbl to be profitable. Other types of oil sands operations require comparatively higher commodity prices with oil sands mining and upgrading being the highest at over US$75/bbl.

  • Export oriented: Though a portion of the crude oil produced in Canada is refined domestically, most of it is destined for export markets. Figure R.12 in the Results section illustrates the supply available for export in the Evolving and Reference scenarios.


Considerations for the Energy Transition

Emissions Intensity of Production

In 2005, the oil sands accounted for approximately 5% of Canada’s GHG emissions. By 2018, it increased to approximately 11%. Absolute oil sands emissions increased by 51% from 2011 to 2018. Most of Canada’s growth in oil production was from the increase in in situ oil sands projects over that period. When measured on a per barrel basis, emission intensity from the oil sands decreased by 22% from 2011 to 2018, from approximately 0.086 tonnes carbon dioxide equivalent per barrel (CO2e/bbl) to 0.067 tonnes CO2e/bbl. See Figure OS.1. Emissions intensity from in situ production decreased by 12% over this time, while mining and upgrading emission intensity decreased by 19%. In 2013, the first standalone mine, Imperial Oil’s Kearl, came into operation, followed in 2017 by Suncor’s Fort Hills mine. As described above, these operations produce diluted bitumen and do not upgrade. The upgrading process is particularly energy intensive and removing it lowers Canada’s production emissions intensity considerably. However those emissions could be realized when it is upgraded/refined elsewhere. From 2013 to 2018, standalone mining emissions intensity declined by 56% from roughly 0.079 tonnes CO2e/bbl to 0.035 tonnes CO2e/bbl as these operations found efficiencies in their processes

Figure OS.1: Emissions per Barrel in the Oil Sands are Declining Figure OS1 Emissions per Barrel in the Oil Sands are Declining
Description

This graph shows historical GHG emissions from the oil sands from 2011 to 2018. In situ emissions fall from 0.08 tonnes of CO2/bbl in 2011 to 0.07 CO2/bbl in 2018. Mining and upgrading emissions fall from 0.09 CO2/bbl in 2011 to 0.07 CO2/bbl in 2018. Emissions from standalone mining operations fall from 0.08 CO2/bbl in 2013 to 0.04 CO2/bbl in 2018. The first standalone mine came into operation in 2013.

Compared to conventional crude oil production in Canada and the rest of the world, the oil sands is more emissions intensive per barrel, particularly in situ production. For comparison, in 2018, conventional oil production in Canada averaged 0.048 tonnes CO2e/bbl.41

The Evolving Scenario includes technological improvements in extraction and upgrading methods of existing projects that continue to develop at the same pace as recent history. Specifically, we assume increased use of solvents for in situ production, and in-pit extraction for mining. As seen in Figure OS.2, these improvements lead to significantly improved per barrel emissions. At the same time, additional improvement is needed to reach net-zero in the oil sands.

Figure OS.2: Oil Sands Emissions per Barrel Decline in the Evolving Scenario Figure OS2 Oil Sands Emissions per Barrel Decline in the Evolving Scenario
Description

This graph shows historical GHG emissions from the oil sands from 2011 to 2018. In situ emissions fall from 0.08 tonnes of CO2/bbl in 2011 to 0.05 CO2/bbl in 2050. Mining and upgrading emissions fall from 0.09 CO2/bbl in 2011 to 0.05 CO2/bbl in 2050. Emissions from standalone mining operations fall from 0.08 CO2/bbl in 2013 to 0.03 CO2/bbl in 2050. The first standalone mine came into operation in 2013.

Global Context

In a global energy system that does move towards net-zero, global crude oil use is very likely to decrease compared to current levels. If demand is decreasing, global crude oil prices, and hence the price received by Canadian producers, will likely be lower than they would be if demand were higher.42 Technologies to achieve net-zero oil sands production can be more costly than traditional methods. A lower price environment may create challenges for producers to afford those investments and remain competitive.

Competitiveness

As global efforts to reduce emissions intensity continue, emissions associated with crude oil production could increasingly influence global investment choices and trade patterns. Increasingly, investors like major banks and sovereign wealth funds, are weighing ESG considerations when deciding where to invest capital. In order to access capital, companies will have to show their compliance with ESG parameters. See the “What is ESG?” section.

What is ESG?

ESG is a framework increasingly used by companies to provide information on their environmental, social, and governance components to investors. In order for companies to gain access to capital, they are often required to prove that their ESG structures are acceptable to investors. The investment community is shifting its attention towards firms that align with their values on ESG performance criteria.1 These criteria can serve as screening mechanisms to scope viable investment opportunities in sustainable companies. In particular, Canadian and global investors are utilizing ESG principles to enhance their potential for future returns, while minimizing their investment risk. Organizations who embed ESG frameworks into their fundamental values can strengthen their resilience to economic and environmental pressures. This heightened resilience provides investors with greater confidence that an organization is prepared for a low carbon energy transition.2

  • The environmental component of ESG evaluates whether a firm's assets are being responsibly and sustainably stewarded. It determines if resources are being utilized at the lowest cost to the environment. Some examples in the oil sands sector include land use and reclamation, air emissions management, water use and availability, and energy use.3

  • The social component outlines how firms engage with their internal and external stakeholders. This includes interactions with employees, shareholders, government divisions, and the greater community they serve. Some examples in the oil sands sector include community and Indigenous Peoples engagement, talent management, and culture of inclusion.4

  • Criteria under the governance component outlines the leadership structure and core principles that influence a firm's operations. Some examples in the oil sands sector include transparent accounting methods, ethical business practices, and diverse governing representation.5

  • (1) Responsible Investment Association, 2018 Canadian Responsible Investment Opportunity: Trends Report, pg. 12, October 2018.
  • (2) IPIECA, Oil and Gas Industry Guidance on Voluntary Sustainability Reporting, 8.
  • (3) Husky, ESG Report 2019, Page 4
  • (4) Husky, ESG Report 2019, Page 4
  • (5) Husky, ESG Report 2019, Page 4


Potential Pathways for Deep Decarbonization

The future of the global oil market as Canada and the world move towards a decarbonized energy system is highly uncertain. Future trends in oil sands production will depend on many factors, including future price levels, policies, and technological developments. Oil sands production would need to remain cost competitive in a global context of declining demand, which will likely put downward pressure on global prices. It will also need to compete in an energy system that increasingly demands emission reductions.

It is difficult to predict just how companies operating in the oil sands will achieve this. However, there are a number of technologies that are at varying stages of development which could be part of the solution. Table OS.1 outlines some of the promising options and their emission reduction potential.

Table OS.1: Options for Emissions-Reducing Technologies in the Oil Sands
Stakeholder(s) Technology Type Emission Reduction Potential Description
Acceleware Ltd. RF XL 50-100% Radio frequency energy to mobilize heavy oil and bitumen, replacing the need for steam.
Source
Suncor Energy, Harris Corporation, CNOOC Limited, Devon Energy Enhanced Solvent Extraction Incorporating Electromagnetic Heating (ESEIEH) 80% Radio frequency energy used in combination with pure solvent to mobilize underground bitumen, replacing the need for steam.
Source
Imperial Oil Enhanced Bitumen Recovery Technology (EBRT) 60% Solvent assisted SAGD reduces the steam required to mobilize bitumen within the reservoir by as much as 25%.
Source
MEG Energy Enhanced Modified Vapour Extraction (eMVAPEX) 43% Condensable gas (e.g. propane) in lieu of steam is injected after initial SAGD operation to support bitumen extraction.
Source
Canadian Natural Resources Limited (CNRL) In-Pit Extraction Process 40% Relocatable, modular extraction plant that can be moved as the mine face advances. Ore processing and bitumen separation occurs adjacent to mining operations, significantly reducing material transportation, reducing emissions fromheavy-duty vehicles.
Source
Cenovus Energy Solvent Aided Process (SAP) 33% A modified SAGD process where NGL-based solvent is combined with steam for bitumen recovery to reduce the steam requirement by up to 30%.
Source
ConocoPhillips Canada, Total E&P Canada Non-Condensable Gas (NCG) CoInjection 15% Prevents energy loss in the reservoir, reducing the amount of steam required for the extraction process, resulting in emission reductions of up to 15% and operating cost reductions.
Source
Suncor Energy, Devon Energy, Suez High Temperature Reverse Osmosis (HTRO) 5-10% High temperature water is recovered, post-SAGD, filtered, and re-used to produce additional steam.
Source

Not all of these technologies will work on all production methods and in all locations. In some cases, these technologies work best when included in the initial design phase of new projects. Some however, like the use of solvents, can be retrofitted onto existing projects. In addition to those listed in the table above, there are other technologies that could play an important role in reducing emission intensities in the oil sands, including:

Small Modular Reactors (SMRs): SMRs are nuclear power plants that have been scaled down in size and capacity. These units can be used to produce the electricity, and heat, used in mining and upgrading operations and in the case of in situ operations, could also produce steam. These units would produce near-zero GHG emissions. Research and development is ongoing,43 and they could play a role at some point in the projection period.

Carbon Capture, Utilization and Storage (CCUS): While reducing the production of GHGs through processes and clean technology innovation, CCUS offers an opportunity to capture CO2 for geological storage and utilization. In some cases, the captured CO2 can also be used for Enhanced Oil Recovery, increasing the production of crude oil by injecting it into active production fields. CCUS is already in use in the oil sands. The Shell Quest CCS facility, in operation since 2015, has been able to store over four million tonnes of CO2 from the Scotford bitumen upgrader. Approximately 35% of the facility's annual CO2 emissions have been successfully captured and stored by this technology. CCUS could be combined with cogeneration, or direct air capture, for additional reductions and/or use opportunities.

KEY UNCERTAINTIES: Oil Sands Emissions

  • Technological Development: The speed with which new technologies are developed and adopted is one of the largest uncertainties.

  • Oil prices and markets: Future crude oil prices and access to markets for growing crude oil production in Canada are also highly uncertain. These factors can affect future production growth, competitiveness, and investments in new technologies.

  • Carbon pricing and/or regulations: Future increases to carbon prices, which would make CO2 more expensive to emit and encourage producers to adopt low-emission technology, are subject to future policy choices by governments. Future regulations limiting CO2 emissions, or requiring adoption of certain technologies, are also highly uncertain.

  • Funding for technologies: Government funding may provide the impetus for the development of many technologies. The extent to which federal and provincial governments will fund these developments is uncertain.

  • Investments in light of ESG trends: Funding will also come from capital markets. The impact of trends related to ESG standards and investor ESG expectations is highly uncertain.

Back to Top

Remote and Northern Communities


Energy Profile of Canada’s Remote Communities

There are approximately 270 remote communities in Canada. Communities are identified as remote if they are not connected to the North American electrical grid, nor to the piped natural gas network, and if they are a permanent or longterm settlement with at least 10 dwellings.44 The largest remote communities in Canada are Whitehorse, Yukon; Yellowknife, Northwest Territories (NWT); and the Magdalen Islands, Quebec.

Table RC.1 organizes Canada’s remote communities by province, and by primary power source. It also breaks down community type (commercial remote communities are typically mines), primary electricity generation source, and accessibility (if the community has access to an all-year road or if the community is fly-in only).

Remote communities face challenges in meeting their energy needs that grid-connected communities don’t. They are highly reliant on diesel fuel for electricity generation and space heating.

While diesel fuel has many benefits, including being widely available, transportable, and an energy dense fuel, there are also notable drawbacks. The remoteness of many communities (the lack of an all-year road, or fly-in status) creates supply security issues. This remoteness also results in high transportation45 costs for diesel and higher energy costs. The small population of many communities results in poor economies of scale in providing energy, further adding to costs for residents. In addition, diesel generators and furnaces emit large quantities of GHGs, various pollutants, and particular matter that affect local air quality. Lastly, diesel fuel spills can also occur and may be costly to remediate.46

Table RC.1: Canada’s Remote Communities, by the Numbers
Canada Yukon NWT Nunavut B.C. Alberta Saskatchewan Manitoba Ontario Quebec Newfoundland
and Labrador
Remote Communities 270 21 38 28 72 6 1 5 29 42 28
TYPE OF COMMUNITY:
Indigenous 167 15 31 25 28 3 1 4 24 22 14
Non-Indigenous 86 6 3 0 40 1 0 1 5 17 13
Commercial 17 0 4 3 4 2 0 0 0 3 1
ELECTRICITY GENERATED BY:
Diesel or Fuel Oil 201 5 27 28 53 6 1 5 29 25 22
Territorial Grid 25 16 9 0 0 0 0 0 0 0 0
Natural Gas 3 0 2 0 0 0 0 0 0 1 0
Hydro 35 0 0 0 14 0 0 0 0 15 6
No Electricity / Other 6 0 0 0 5 0 0 0 0 1 0
ACCESSIBILITY:
All Year Road Access 102 20 20 0 31 5 1 0 7 5 13
Fly-in Community 102 1 18 28 0 1 0 5 22 20 7
Other Access 66 0 0 0 41 0 0 0 0 17 8
Total Population 188 828 31 454 42 061 36 672 10 425 893 10 3 545 16 607 38 823 8 338
Description

Source: Natural Resources Canada, Remote Communities Energy Database, CER calculations

Notes: Several communities with no population data were excluded from the above table. Additionally, Pikangikum, Ontario (grid connected in 2018) and Jasper, Alberta (grid connected in 2019) are also excluded. Under Accessibility, “Other Access” includes seasonal roads and some marine.

Considerations for the Energy Transition

The uniqueness of Canada’s remote communities will shape their energy transition. Key drivers of potential change are:

  • Indigenous Communities: Table RC.1 indicates that the majority of remote communities (167 of 270, or about 62%) are categorized as Indigenous. Of these communities, 84% are powered with diesel generators. The shift away from fossil fuels for these communities represents one possible pathway to advancing reconciliation and could help advance goals of Indigenous self-determination and self-reliance.47 Community-led and community-owned projects could lead to improved energy security, as well as economic opportunities for remote and northern Indigenous communities.

  • Climate: The vast majority of residents in remote communities live in northern climate regions. These regions are defined by long and cold winters and short summers. Heating degree days (HDDs), the standard measure for space heating requirements in an area, are notably higher in northern regions of Canada than in southern regions.48 Energy is key for survival; making energy security is a top priority for remote and northern communities.

  • Electricity: Table RC.1 illustrates that the majority of remote communities(207 of 270, or about 77%) are powered by diesel fuel, heavy oil, or by personal diesel generators. Some communities are covered by a territorial grid or regional micro-grid. The majority of communities and residents in Yukon are connected through the primarily hydro-based Yukon grid. Communities around the Great Slave Lake in NWT are also connected by one of two (primarily) hydro-based grids. None of these territorial grids are connected to each other, nor are any connected to the main North American electricity grid. Hydro-based electricity generation in Yukon and NWT stands in contrast to electricity generation Nunavut, as shown in Figure RC.1. Nunavut’s 25 Indigenous communities and three commercial operations are all disconnected from each other, each relying almost entirely on local diesel generation. Lastly, communities along Quebec’s Lower North Shore are connected by an off-grid hydro system that is also connected with the L’Anse au Loup system in southern Labrador.

  • Space Heating: In the vast majority of remote communities, space heating is primarily by diesel fuel or heating oil. Less common methods of home heating are with electricity, propane, and wood. Diesel demand for space heating in remote communities is double that of diesel demand for electricity generation.49 Remote communities connected to a territorial, or small hydro grid, still rely heavily on diesel fuel for space heating as current hydro capacity would be insufficient to handle all winter heating demand if most, or all buildings, were to switch to electric heating.

  • Transportation: Less than half of all remote communities have all-year road access, and 38% are considered fly-in communities. Communities that do not have an all-year road, but are not considered fly-in, may have access to a winter road, barges, or marine vessels. Personal transportation is more limited in communities lacking an all-year road, and the reliance on air transport for freight and people comes at considerable environmental and financial costs.

  • Commercial Communities: The Remote Communities Energy Database identifies 17 commercial communities in Canada, and the majority of these are mining operations. All commercial operations, with the exception of the natural-gas powered Renard Diamond Mine in northern Quebec, rely on diesel for electricity generation. One of the largest consumers of diesel fuel is the Diavik Diamond Mine in NWT. In 2012, 9.2 megawatts (MW) of wind turbine capacity was installed at the mine, making it the world’s largest and northernmost diesel-wind hybrid power facility.50

  • Policy: The Pan-Canadian Framework on Clean Growth and Climate Change commits to reducing GHG emissions by supporting rural and remote communities in their transition towards more secure, affordable, and cleaner sources of energy.51 In early 2019, the Indigenous Off-diesel Initiative was launched by the federal government and partners to help communities move away from using diesel fuel by developing cleaner community-led energy projects.52 This initiative builds on over $700 million previously committed funds to help remote communities switch to new energy sources

Figure RC.1: Electricity Generation in the Northern Territories in 2018 Figure RC1 Electricity Generation in the Northern Territories in 2018
Description

These three pie graphs show electricity generation by fuel type in Canada’s northern territories for 2018. In Yukon, 446 GW.h of electricity was generated from hydro (94%) and oil (6%). In NWT, 479 GW.h of electricity was generated from hydro (53%), oil (40%), natural gas (4%), and wind (4%). In Nunavut, 237 GW.h of electricity was generated, entirely from oil.

Variable Renewable Energy in Remote Communities

Figure RC.2 displays estimated capacity factors for wind and solar in three remote communities: Old Crow, Yukon; Nain, Labrador; and Obedjiwan, Quebec. In Nain, for example, the estimated capacity factor for wind averages 56% between November and April (peaking at 60% in February), but averages 26% between May and August. In Old Crow, the estimated capacity factor for solar averages 20% between April and August (peaking at 23% in June), but averages 2% between October and February. Located above the Arctic Circle, the estimated capacity factor for solar in Old Crow declines to 0% for December and January.1 The variability of monthly average capacity factors illustrate the importance of choosing the right renewable generation source, or mix of sources, for each community.

  • (1) Numbers represent a monthly average. Solar PV systems can experience rapid changes with cloud cover over the solar panels.
Figure RC.2: Monthly Capacity Factors for Wind and Solar: Three Examples Figure RC2 Monthly Capacity Factors for Wind and Solar: Three Examples
Description

These two column charts illustrate monthly average capacity factors for wind and solar generation in Old Crow, Yukon; Nain, Labrador; and Obedjiwan, Quebec.

In Old Crow, the capacity factor for wind averages 27.5% with a low of 15.9% in June and a high of 40.3% in February. The capacity factor for solar averages 10.7% with a low of 0% in December, and a high of 23.2% in June.

In Nain, the capacity factor for wind averages 44.2% with a low of 22.5% in May and a high of 60.3% in February. The capacity factor for solar averages 12.4% with a low of 3.2% in December, and a high of 22.1% in April.

In Obedjiwan, the capacity factor for wind averages 26.6% with a low of 21.3% in May and a high of 34.0% in March. The capacity factor for solar averages 13.9% with a low of 5.2% in December, and a high of 21.3% in July.


Potential Pathways for Deep Decarbonization

The diversity and unique challenges of remote and northern communities will shape the future of their energy systems in a world moving towards net-zero. This section will discuss the options that exist, or could exist, in the near and longer term to help remote communities transition away from carbon-emitting fossil fuels.


KEY TRENDS: Transitioning Remote Communities

  • More renewables, like wind, solar, biomass and hybrid systems, are being explored and implemented to offset diesel consumption.

  • Movements are being made away from diesel for home heating, and there is potential for biomass in many communities. This is in addition to improved building envelopes and building with higher standards to improve energy efficiency.

  • More community-led and owned projects are being implemented, particularly with an Indigenous component.

  • Stronger policies are being implemented at the provincial, territorial and federal levels to help remote communities reduce and eliminate their reliance on diesel.

Key Uncertainties: Transitioning Remote Communities

  • Policies in place: Government support for off-diesel initiatives and community led projects are key to transitioning remote communities towards net-zero. However, future policies and project economics are uncertain.

  • Technological advancements: Improvements in efficiencies and costs for traditional renewables, next generation renewables, and energy storage have significant implications for remote communities. For instance, technological advancements might allow renewables to operate more reliably in extreme cold. But, the pace at which technologies are developed and adopted is uncertain, in part depending on government funding.

  • Costs: Roughly one-third of communities considered in this section are fly-in, and less than half have an all-year road. Estimating the environmental and financial costs of transporting materials to, and building in, very remote communities is uncertain.

Table RC.2: Potential Options for Partial or Full Decarbonization of Remote Communities
Electricity

Traditional renewables: solar, small and large hydro, and biomass, are currently helping several Traditional renewables, including wind, remote communities displace diesel used for electricity generation.53 Other than large (reservoir) hydro (which is limited by geography), traditional renewables by themselves have a very limited role in providing stable baseload generation for remote communities, particularly during the winter peaks. (See text box: Variable Renewable Energy in Remote Communities)

Emerging technologies: Could include next generation biofuels, hydrogen, geothermal, and nuclear in the form of SMRs. For stable, long-term baseload generation, SMRs could hold the most promise. Canadian SMR Roadmap notes that very small SMRs could address the electricity needs for remote communities, while small to medium SMRs could be used for off-grid heavy industry.54 The roadmap notes that SMRs could also open up remote communities to further economic development by offering reliable bulk energy

Grid connection: Remote communities can move away from diesel for electricity generation by connecting to bulk electricity grids. A connection to the North American grid would provide abundant and stable electricity for remote communities

Generally, the shorter the distance from a transmission line, and the larger the community being connected, the more feasible the choice of a grid connection becomes.55 The largest drawback of this option may be cost.56

Demand-side measures: Demand-side changes to decarbonize electricity production include the introduction of more stringent building standards and energy efficiency measures, demand-side management and smart metering, and dual metering (for example, one meter used for household use, another used for space heating).57

Energy storage: Energy storage can be an important part of integrating variable renewable energy, particularly with respect to short term variations. Energy storage may be particularly helpful for micro-grids, in providing essential reliability services such as frequency support and reserve capacity.58 As costs fall and technology improves, energy storage could play an increasing role in remote communities.

Space Heating

Biofuels: Space heating needs for remote communities could be achieved through biomass or next generation biofuels, either through point source heating, or more centralized methods like district heating or combined heat and power.59 A study of wood pellet district heating in NWT noted that favourable economic potential exists in several all-year road and winter road communities.60 The economics for biomass district heating are higher when wood pellets are substantially cheaper than other fuels, when buildings are clustered together, and when project costs are low.

Another study that focused on Inuvik, NWT noted that the cost of wood pellets were lower per unit of energy than any other fuel options for residents. While high capital costs associated with converting furnaces to wood pellet boilers may negate lower fuel costs, the study noted that large commercial and institutional customers have short payback periods on investments.61

Alternative district heating options: SMRs could generate enough electricity to meet peak winter needs for space heating, as noted in Canada’s SMR roadmap. A project to develop an SMR for district heating was recently launched in Finland.62

Transportation

Zero emission vehicles: for remote communities.63 Adoption could be slower in communities The transition to ZEVs presents a challenge located in the coldest regions in Canada, and for communities that are not connected to a larger regional grid, or the North American grid. A case study in Yellowknife involved a plug-in hybrid vehicle64. While the study noted issues related to operating a plug-in hybrid in extreme cold,65 the study did conclude that plug-in hybrids are viable vehicles for northern climates with a battery range suitable for city driving.

The study also noted that battery EVs with a longer range would require a network of fast charging stations along NWT’s highways. A more recent test study found a roughly 18.5% reduction in range, and that charging complications can be expected from EVs in the cold.66

Next generation biofuels and hydrogen: Other options such as next generation biofuels and hydrogen fuel cells could be useful for areas where energy density is valuable, including personal and freight road transportation, as well as marine and air travel.

Back to Top
  • [27] Climate Ambition Alliance: Nations Renew their Push to Upscale Action by 2020 and Achieve Net Zero CO2 Emissions by 2050.
  • [28] Government of Canada releases emissions projections, showing progress towards climate target.
  • [29] Rogelj et al. (2015) discuss the appropriateness of net-zero GHG emissions goals serving as benchmarks for achieving global temperature targets.
  • [30] Davis et al. (2018) review what it would take to achieve decarbonization of the energy system.
  • [31] In addition, Davis et al. (2018) provide a recent review of carbon management methods.
  • [32] These reduction levels are for illustrative purposes, and reflect existing government targets (30% below 2005), as well as levels of reduction (60 and 90%) covered in various studies of deep emissions reductions, such as Trottier Energy Futures Project (2016), Canadian Deep Decarbonization Pathway Project (2015), and Canadian Energy Outlook 2018 – Horizon 2050 (2018). Canada’s Mid-Century Long-Term Low-Greenhouse Gas Development Strategy examines an emissions abatement pathway consistent with net emissions falling by 80% from 2005 levels.
  • [33] (Trottier Energy Futures Project, 2016) For example, the Trottier Energy Futures Project (2016) found that energy conservation initiatives can eliminate a large share of future demand for commercial sector space heating.
  • [34] For further explanation see Bataille, Sawyer, & Melton (2015), Trottier Energy Futures Project (2016), and Vaillancourt, Bahn, Frenette, & Sigvaldason (2017).
  • [35] See for example N. Rivers and B. Schaufele (2015) “Salience of carbon taxes in the gasoline market.” Journal of Environmental Economics and Management. Volume 74; J.T. Bernard and M. Kichian (2019). “The long and short run effects of British Columbia’s carbon tax on diesel demand” Energy Policy. Volume 131.
  • [36] Bloomberg New Energy Finance forecasts $100/kW.h to be reached by 2024.
  • [37] MIT Energy Initiative. 2019. Insights into Future Mobility.
  • [38] Based on current data on battery degradation, and the lower maintenance and repairs required by EVs, we are assuming longer lifespans for EVs.
  • [39] In discussing the passenger transportation sector, the vehicles being analyzed are those weighing less than 4 500 kg; these will also be referred to as light-duty vehicles (LDVs). The historical annual growth rate of the vehicle stock from 2002 – 2018 was 1.74%, the projected growth rate is slightly less at 1.4%.
  • [40] Bitumen mixed with diluent.
  • [41] See Figure 2-25 in ECCC's latest National Inventory Report.
  • [42] For example, the International Energy Agency’s “Sustainable Development Scenario,” in the World Energy Outlook includes a lower crude oil price compared to the scenarios with less policy action and higher crude oil demand.
  • [43] Canadian SMR roadmap.
  • [44] Natural Resources Canada, Remote Communities Energy Database.
  • [45] Via truck (on an all-year road, or winter road), ship, barge, or even air.
  • [46] Knowles, J. (2016). Power Shift: Electricity for Canada’s Remote Communities. The Conference Board of Canada.
  • [47] Heerema, D. and Lovekin, D. (2019). Power Shift in Remote Indigenous Communities. The Pembina Institute.
  • [48] HDDs are defined as the number of degrees Celsius (°C) the daily mean temperature is below 18°C. HDDs in Iqaluit, Nunavut averaged 10 282 between 1976 and 2005. By contrast, HDDs in Montreal and Toronto over this period averaged 4 349 and 3 762, respectively. In Vancouver, one of Canada’s warmest cities, HDDs averaged 2 776. The source for this data is the Prairie Climate Centre’s Climate Atlas of Canada.
  • [49] Moorhouse, J., Lovekin, D., Morales, V., and Salek, B. (2020). Diesel Reduction Progress in Remote Communities: Research Summary (p. 1). The Pembina Institute.
  • [50] NRCan (2017). “Diavik Diamond Mine – Northwest Territories”.
  • [51] NRCan (2020). “Reducing diesel energy in rural and remote communities”.
  • [52] Government of Canada (2019). “Canada Launches Off-Diesel Initiative for Remote Indigenous Communities”.
  • [53] Moorhouse, J., Lovekin, D., Morales, V., and B. Salek (2020) Diesel Reduction Progress in Remote Communities: Modelling approach and methodology. The Pembina Institute.
  • [54] NRCan (2018). “Canadian Small Modular Reactor (SMR) Roadmap”.
  • [55] Grid connections have already been accomplished in Pikangikum, Ontario (2018) and Jasper, Alberta (2019). Hydro Quebec is planning to connect the Magdalen Islands with a sub-sea cable by 2025. The project would serve 6 600 customers and eliminate 40 million litres of fuel oil burned on the islands for electricity generation annually.
  • [56] Knowles, J. (2016). Power Shift: Electricity for Canada’s Remote Communities (pp. 22-23). The Conference Board of Canada.
  • [57] Moorhouse, J., Lovekin, D., Morales, V., and Salek, B. (2020). Diesel Reduction Progress in Remote Communities: Modelling approach and methodology. The Pembina Institute.
  • [58] NRCan (2018). “Towards Renewable Energy Integration in Remote Communities: A Summary of Electric Reliability Considerations.”
  • [59] Moorhouse, J., Lovekin, D., Morales, V., and B. Salek (2020) Diesel Reduction Progress in Remote Communities: Modelling approach and methodology (p. 3). The Pembina Institute.
  • [60] Arctic Energy Alliance (2010). “NWT Community Wood Pellet District Heating Study”.
  • [61] Arctic Energy Alliance (2012). “Inuvik Wood Pellet Infrastructure Study”.
  • [62] World Nuclear News (24 February 2020). “Finnish firm launches SMR district heating project”.
  • [63] Motor vehicle ownership is more common in communities with an all-year road, but for the approximately 140 communities without an all-year road, private vehicle ownership can be very low.
  • [64] Arctic Energy Alliance (2016). “Electric Vehicle Study: Chevrolet Volt Plug-in Hybrid Electric Vehicle 2015-16”.
  • [65] These issues include range reduction, frequent battery conditioning during extreme cold, charger drop-off, and failure to start from a cold auxiliary battery.
  • [66] Norwegian Automobile Foundation (2020). “20 popular EVs tested in Norwegian winter conditions”.

Notice: On 2 December 2020, a note for additional clarity was added to Figures ES.8 and R.12 in this PDF.

Date modified: