Employment Equity Report 2023-24

Employment Equity Report 2023–24 [PDF 947 KB]
September 13, 2024
ISSN 2563-7088
Copyright/Permission to Reproduce
Contents
- Employment Equity Report 2023-24: Executive Summary
- Building a Representative Workforce for Canada's Energy Future
- Initiatives To Enhance Equity, Diversity, and Inclusion
- 1. Reconciliation: A Journey of Continuous Improvement
- 2. Diversity and Belonging Roadmap: Driving Change
- 3. Building an Accessible Workplace
- 4. Enhancing Employment Equity: Ongoing Efforts
- 5. Fostering a Culture of Inclusion and Investing in Learning and Development
- 6. Enhancing Data Collection and Analysis
- Conclusion
- Workforce Analysis
- Data Sources
- Employment Equity Progress at the CER (FY 2023-24)
- Representation in Hiring, Promotions, and Departures by Designated Group
- Remuneration by Designated Group (FY 2023-24) with Focus on Equity and Trend Analysis
- Summary, Insights, and Recommendations for Improved Employment Equity at the CER
- Employee Engagement: Consultations and Collaboration
- Looking Forward
- References
- Annex A – Employment Equity, Diversity, and Inclusion Plan
- Annex B – Employment Equity Goals for 2023–25
Employment Equity Report 2023-24: Executive Summary
Introduction
The Canada Energy Regulator (CER) is dedicated to fostering a diverse, inclusive, and equitable workplace that actively supports Reconciliation. This report highlights the CER's progress in achieving this goal during the 2023-24 fiscal year. It details the organization's achievements, ongoing challenges, and key initiatives aimed at advancing employment equity for designated groups: women, Indigenous Peoples, visible minorities, and persons with disabilities.
Workforce Representation
The CER has made notable progress in increasing representation of designated groups this year. We strengthened our diversity at the executive level with the hiring of members of visible minority groups in Executive Vice President and Vice President positions, the latter becoming effective on April 1, 2024. The remaining opportunity lies in further enhancing the representation of Indigenous Peoples and persons with disabilities in senior leadership roles. We are actively working to achieve this. Women continue to be well-represented across the organization.
Overall Employment Equity Representation
The infographic below presents these key findings:
- Women: Representation at 65.3%, exceeding the external labour market availability of 46.1%.
- Indigenous Peoples: Representation at 4.2%, exceeding the external labour market availability of 2.6%. However, gaps exist within the executive ranks and clerical personnel group. The CER will leverage its Indigenous Recruitment, Retention, and Advancement Strategy (IRRAS) to target recruitment for senior management roles.
- Visible Minorities: Representation at 23.8%, slightly above the external labour market availability of 23.5%. Gaps persist in professional, semi-professional, and supervisor groups.
- Persons with Disabilities: Representation at 7.7%, below the external labour market availability of 8.7%. Targeted recruitment in the professional, supervisor, administrative and senior clerical, and clerical groups can address these gaps.
Key Initiatives
The CER has implemented a series of initiatives aimed at fostering Reconciliation, diversity, inclusion, accessibility, and equity in the workplace:
- Diversity and Belonging Roadmap: Focuses on creating a culture of inclusion by addressing misconduct, supporting employee advancement, and diversifying recruitment efforts.
- Indigenous Recruitment, Retention, and Advancement Strategy (IRRAS): Aims to increase Indigenous representation through strategic recruitment and career development, addressing bias and fostering a supportive work environment.
- Accessibility Plan: Enhances accessibility for persons with disabilities, aligned with the Accessible Canada Act
Graphic Description
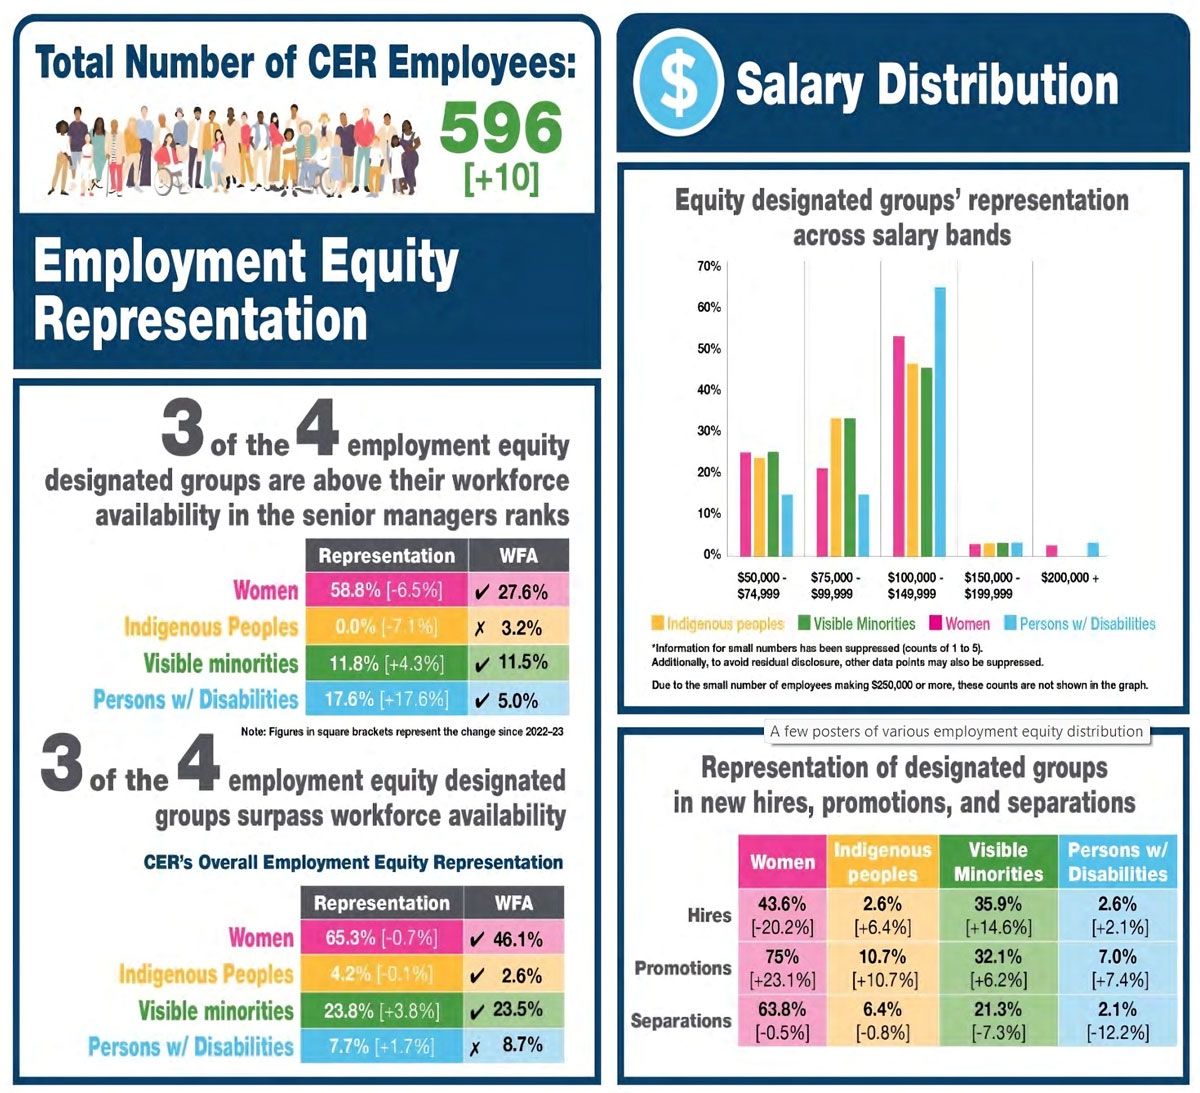
The Canada Energy Regulator (CER) employs 596 staff, up by 10 from the previous year.
Employment Equity – Senior Managers:
3 out of 4 equity groups exceed their workforce availability in senior roles. Women (58.8%), visible minorities (11.8%), and persons with disabilities (17.6%) are all above benchmarks. Indigenous Peoples are underrepresented at 0%.
Overall Equity Representation:
Women (65.3%), Indigenous Peoples (4.2%), and visible minorities (23.8%) exceed workforce availability overall. Persons with disabilities (7.7%) are slightly below.
Salary Distribution:
A bar chart shows equity group representation across salary bands. Women and visible minorities are most represented in the $100k–$149.9k range. Indigenous Peoples and persons with disabilities are less represented at all levels.
Hires, Promotions, Separations:
Women saw strong promotions (75%) but fewer hires (43.6%). Visible minorities had increases in both hires and promotions. Indigenous and disabled groups also saw progress, especially in promotions.
Priorities Moving Forward
The CER remains committed to achieving employment equity. Key priorities include:
- Leveraging Cultural Assessment and Developing People Strategy: Using insights from the Cultural Assessment to develop a People Strategy supporting future recruitment and retention, as well as fostering an inclusive work environment.
- Implementing the IRRAS: Continuing to implement the IRRAS strategy to increase Indigenous representation and retention across the organization, particularly in executive and leadership ranks.
- Targeted Recruitment for Visible Minorities: Focusing recruitment efforts on attracting visible minority candidates for professional, semi-professional, and supervisor roles.
- Targeted Recruitment for Persons with Disabilities: Focusing recruitment efforts on attracting candidates with disabilities for professional positions to close current gaps.
- Monitoring and Measuring Progress: Regularly evaluating initiatives to ensure effectiveness in achieving employment equity goals.
- Accountability and Transparency: Assigning clear roles, responsibilities and performance expectations to senior leaders to drive progress in employment equity, diversity, inclusion, and Reconciliation.
Conclusion
The CER demonstrates a strong commitment to building a diverse and inclusive workforce. The initiatives outlined in this report pave the way for a more equitable workplace that reflects the talent available in the Canadian labour market. By focusing on targeted recruitment efforts, the CER can address remaining gaps and achieve equitable representation for all designated groups.
Building a Representative Workforce for Canada's Energy Future
The CER plays a vital role in ensuring safe, reliable, and environmentally sustainable energy delivery across Canada and beyond. Our mission includes preventing harm, respecting Indigenous rights, and providing crucial energy data for Canada's transition to a net-zero future. We aim to be a recognized leader in energy infrastructure regulation, fostering trust with Canadians and upholding Indigenous rights. Building a strong, diverse, and equitable workforce is fundamental to achieving these ambitious goals.
This Employment Equity Report 2023-24 serves as a roadmap toward building such a workforce. It details our progress in creating a team that reflects Canada's diversity, equipped to effectively implement the CER's mission, vision, and strategic priorities outlined in the 2024-27 Strategic Plan.
Aligning Our Workforce with Updated Priorities
The CER's 2024-27 Strategic Plan establishes four key priorities that guide our work:
- Trust and Confidence: Building and maintaining public trust is paramount. A diverse and engaged workforce fosters inclusivity and transparency, allowing Canadians to see themselves reflected in the organization responsible for regulating their energy future. This priority also emphasizes empowering our diverse workforce, further strengthening trust and confidence.
- Competitiveness and Regulatory Excellence: As Canada transitions towards a net-zero future, fostering a competitive and innovative energy sector is essential. A well-represented team with diverse expertise can analyze energy trends, develop forward-thinking regulations, and ensure Canada's energy sector remains globally competitive.
- Reconciliation and Implementing the United Nations Declaration on the Rights of Indigenous Peoples: The CER is committed to working collaboratively with Indigenous Peoples, ensuring their voices are heard in energy decision-making. A diverse workforce, with strong representation from Indigenous communities, is crucial to fostering trust and building strong relationships in line with the UN Declaration on the Rights of Indigenous Peoples Act.
- Preparing for the Energy Future: The energy landscape is constantly evolving, particularly with the focus on net-zero. Fostering a diverse and inclusive team allows us to tap into a wider pool of talent and ideas, ensuring we have the expertise required to navigate the energy transition, address future challenges, and offer insightful expertise for Canada's transition.
Employment Equity at the CER: Progress and Action Plan
This Employment Equity Report 2023-24 delves deeper into the current state of employment equity at the CER. We highlight areas of success, such as reduced employment equity gaps, and outline ongoing challenges. The report details our initiatives, including the Diversity and Belonging Roadmap (D&B Roadmap), implemented from September 2023 to March 31, 2024. The successful implementation of the D&B Roadmap recommendations and its impact on creating an inclusive workplace will be explored in a subsequent section. Additionally, the progress of other initiatives like the IRRAS and Accessibility Plan will be discussed in dedicated sections.
Building a strong, diverse, and equitable workforce isn't just the right thing to do; it's the cornerstone of achieving the CER's mission, vision, and strategic priorities. This report serves as a roadmap for achieving that goal. It details our progress in cultivating a team that reflects Canada's rich diversity, a team equipped to effectively implement the CER's mandate and navigate the evolving energy landscape with its unique challenges and opportunities.
Employment Equity and Reporting
LEGAL AND REGULATORY FRAMEWORK
The CER is mandated by the Employment Equity Act (EEA) subsection 4(1)(c) to report annually on its progress towards achieving a representative workforce. This legislative requirement ensures that the CER actively promotes employment equity and works towards creating a diverse and inclusive workplace. In addition to the EEA, the CER also upholds the requirements of the Public Service Employment Act (PSEA), Accessible Canada Act, Canadian Human Rights Act, The Canadian Charter of Rights and Freedoms and the UN Declaration on the Rights of Indigenous Peoples Act (UNDA). The organization adheres to these legal and regulatory frameworks to ensure fair and equitable employment practices.
IMPORTANCE OF EMPLOYMENT EQUITY REPORTING
The CER recognizes the significance of employment equity reporting as a vital tool for assessing and monitoring its progress in creating a representative workforce. The 2023- 24 Employment Equity Report demonstrates continued progress towards achieving this goal, particularly in the area of visible minorities and people with disabilities.
The annual Employment Equity Report provides a comprehensive analysis of the designated groups for employment equity, which include women, Indigenous Peoples, people with disabilities, and visible minorities. The report presents a workforce analysis based on these groups, focusing on the Employment Equity Occupational Groups (EEOG), geographic regions, and salary ranges. Additionally, the report examines the representation of hires, promotions, and departures among the employment equity designated groups.
The workforce data included in the report encompasses indeterminate employees and employees with service terms of three months or more in substantive positions. However, it excludes students, employees on secondment from other organizations, terms of less than three months, and casual workers. By analyzing this data, the CER gains insights into the representation and progress of the designated groups within its workforce.
The Employment Equity Report also highlights the initiatives and networking activities undertaken by the CER during the reporting period to implement its Equity, Diversity, and Inclusion (EDI) Strategy. This demonstrates the organization's commitment to proactively promoting a diverse and inclusive work environment.
Beyond legal requirements, the CER's commitment to employment equity aligns with the broader objectives outlined in the Accessibility Strategy for the Public Service of Canada, the Call to Action on Anti-racism, Equity, and Inclusion in the Federal Public Service, the Calls to Action of the Truth and Reconciliation Commission of Canada, and the Federal 2SLGBTQI+ Action Plan, all of which incorporate Gender-based Analysis Plus. This inclusive approach considers the intersecting identity factors of diverse groups to develop, deliver, and evaluate initiatives more effectively.
By adhering to these policies and strategies, the CER aims to ensure that it creates a discrimination-free workplace and addresses any workplace disadvantages faced by members of the designated groups. The core principle of employment equity, as defined by the EEA and the PSEA, is to hire and promote individuals based on merit, job-related skills and qualifications, ensuring a fair and inclusive selection process. The CER emphasizes the importance of including members from the designated groups in the applicant pool, providing equal opportunities for employment and advancement to all individuals.
In conclusion, employment equity reporting is a crucial aspect of the CER's commitment to creating a representative and inclusive workforce. By complying with legal requirements, analyzing workforce data, implementing initiatives (including D&B Roadmap, Accessibility Plan and IRRAS), and promoting fairness in the selection process, the CER strives to foster an equitable work environment where all employees have equal opportunities for growth and success. This Employment Equity Report encapsulates findings from the period spanning April 1, 2023, to March 31, 2024.
Employment Equity Plan 2021-24
EMPLOYMENT EQUITY PLAN
The 2021-24 Employment Equity Plan serves as a cornerstone for the CER’s commitment to achieving a workforce that reflects the diversity of Canada. Aligned with the Employment Equity Act (EEA), this three-year Employment Equity Plan outlines the CER's ongoing efforts to build a workplace characterized by inclusivity, fairness, and equal opportunity.
EMPLOYMENT EQUITY PLAN UPDATES FOR 2023-24
Building upon the foundation established in previous years, the 2023-24 iteration of the Employment Equity Plan incorporates the following key updates:
- Enhanced Focus on Key Priorities: As with the current statistics of employment equity representation at CER, we have an overall gap in the representation of people with disabilities. The CER is also committed to working collaboratively with Indigenous Peoples. A diverse workforce, with strong representation from Indigenous communities, is crucial to fostering trust and building strong relationships. In line with the UN Declaration on the Rights of Indigenous Peoples Act, the CER continues its efforts to ensure their voices are heard in energy decision-making.
- The Employment Equity Plan prioritizes targeted strategies to increase the representation of both people with disabilities and Indigenous Peoples within the CER. This includes the ongoing implementation of the IRRAS.
- Alignment with Legislative Changes: The Employment Equity Plan aligns with recent amendments to the PSEA by incorporating the implementation of:
- Unconscious Bias Training Program: This program equips managers and employees with the knowledge and skills to identify and mitigate unconscious bias in recruitment, promotion, and development opportunities.
- Diverse Hiring Boards: The Employment Equity Plan emphasizes the importance of diverse hiring boards to ensure a wider range of perspectives are considered during the selection process.
GOALS AND TARGETS FOR 2023-24
The 2023-24 Employment Equity Plan establishes specific goals and measurable targets aimed at advancing employment equity within the CER. These objectives consider:
- Progress made on goals established in the previous year (2022-23).
- Identified employment equity gaps within the organization.
- Representation across occupational groups and levels.
Detailed information on the Employment Equity Plan and goals and targets is available in Appendices A and B of this report.
STRATEGIES AND INITIATIVES
The Employment Equity Plan outlines a comprehensive framework of strategies and initiatives designed to achieve the established goals. These initiatives focus on continual improvement of our systems, processes and tools to align with the identified gaps in our workforce representation and operational needs:
- Recruitment and Retention: Implementing targeted recruitment strategies to attract qualified candidates from diverse backgrounds. Additionally, fostering a psychologically safe workplace through initiatives such as the Mental Health Committee, Ethics Committee, Employee and Family Assistance Program, Occupational Health and safety, and Ombuds services is crucial for employee engagement and retention.
- Diversity and Inclusion Training: Equipping managers and employees with the knowledge and skills to create a more inclusive work environment. This includes unconscious bias training and Indigenous cultural competency workshops.
- Mentorship and Career Development: Providing mentorship opportunities and career development programs to support the advancement of employees from designated groups.
- Accessibility: Ensuring a work environment that is accessible and inclusive for employees with disabilities.
The CER remains committed to ongoing monitoring and evaluation of the Employment Equity Plan's effectiveness. This allows for adjustments and improvements to ensure consistent progress towards achieving employment equity objectives.
Conclusion
The 2021-24 Employment Equity Plan serves as a roadmap for the CER's unwavering commitment to cultivating a diverse and inclusive workplace. We acknowledge the importance of continuous improvement and strive to address existing barriers faced by designated groups. Through the successful implementation of this Employment Equity Plan, the CER aspires to build a workforce that reflects the richness and diversity of the Canadian population.
Initiatives To Enhance Equity, Diversity, and Inclusion
The CER is unwavering in its commitment to fostering a diverse, inclusive, and equitable workplace. The CER has integrated Equity, Diversity and Inclusion (EDI) into its strategic priorities, particularly within the context of Trust and Confidence, as well as Reconciliation. The Board of Directors, along with the Indigenous Advisory Committee, play key roles in strategically advising initiatives aimed at promoting employment equity, diversity, and inclusion within the organization. The CER has maintained strong representation of women and Indigenous Peoples, consistently exceeding workforce availability, while significantly increasing representation of visible minorities and persons with disabilities. Notably, the CER has surpassed the labour market availability (LMA) of visible minorities representation for the first time.
However, challenges persist in achieving equitable representation in specific occupational groups for Indigenous Peoples and visible minorities and overall, people with disabilities are underrepresented at the CER. These results underscore the ongoing necessity for sustained efforts and a strong focus on diversity and inclusion. Building upon the foundation established in previous years, this section highlights the progress made in key initiatives throughout 2023-24.
1. Reconciliation: A Journey of Continuous Improvement
Achieving significant and lasting change for Indigenous employees within the CER is a long-term journey. We are committed to this path and understand that setting realistic expectations is crucial.
The CER's Indigenous Cultural Intelligence Framework (ICIF) serves as a roadmap for fostering cultural intelligence within the organization. This framework, which currently has five baskets of work, goes beyond training by encompassing new programs, policies, and procedures that promote respectful relationships with Indigenous colleagues and communities. The ICIF aims to build competency and contribute to the transformative changes for all CER employees required for Reconciliation and alignment with the UN Declaration on the Rights of Indigenous Peoples (UN Declaration).
Key initiatives under the ICIF include:
- Indigenous Recruitment, Retention, and Advancement Strategy (IRRAS): This strategy outlines a comprehensive approach to attracting, retaining, and advancing Indigenous talent within the CER. The IRRAS aligns with the CER's Reconciliation and Implementing the UN Declaration Strategic Priority, Trust and Confidence Strategic Priority, Diversity and Belonging Initiative and aligned with the Government of Canada Many Voices One Mind: a Pathway to Reconciliation report. It aims to break down barriers, decolonize and Indigenize policies and practices, and create a welcoming and inclusive work environment.
- Elder-in-Residence Program (under development): This program will provide culture-based counselling, guidance, and support to Indigenous employees, fostering a deeper understanding of Indigenous ways of knowing and being. It will further strengthen the foundation for meaningful relationships and cultural competency within the CER
BUILDING CULTURAL INTELLIGENCE
The CER recognizes the importance of ongoing learning and unlearning in our journey towards Reconciliation. Public Service Employee Survey (PSES) results over the last few years have documented the issues and concerns Indigenous Peoples have experienced as employees of the CER. 2020 PSES results show 52% of CER Indigenous respondents indicated that they were victims of discrimination at the CER, the highest discrimination rate reported, and nearly five times the public service average.
We are actively integrating the principles of the UN Declaration into our work and collaborating with Indigenous governments, communities, and organizations. This collaboration fosters a deeper understanding of Indigenous perspectives and allows us to continuously improve how we work together.
KEY ACHIEVEMENTS IN FY 2023-24
- Continued implementation of the ICIF to build cultural intelligence across the organization.
- Development of the IRRAS, establishing clear objectives for recruiting, retaining, and advancing Indigenous employees.
- The provision of courses and learning opportunities as part of the commitments under the Truth and Reconciliation Call to Action #57 and beyond.
- Progress towards establishing the Elder-in-Residence Program.
LOOKING AHEAD
In FY 2024-25, we will focus on:
- Continued implementation of the ICIF, including a change management strategy, to build and mature cultural intelligence across the organization.
- Implementation of the IRRAS, approved in May 2024, by executing key actions outlined in the strategy.
By acknowledging the long-term nature of Reconciliation and implementing these comprehensive strategies, the CER is committed to building a more inclusive and culturally intelligent workplace for all employees, particularly Indigenous Peoples.
2. Diversity and Belonging Roadmap: Driving Change
Developed in consultation with employees, including Indigenous Peoples, the Diversity and Belonging Roadmap (D&B Roadmap) was implemented from September 22, 2023, to March 31, 2024, to foster a more inclusive workplace. The D&B Roadmap addressed key areas aligned with the goals of the IRRAS:
Addressing Misconduct: To foster a psychologically safe workplace for all employees, including Indigenous Peoples, enhancements were made to prevent and respond to misconduct. These included increased training for managers and employees, the publication of internal disclosure reports related to Occupational Health and Safety (OHS) and Labour Relations, and sessions facilitated by the Ombuds for Small Departments and Agencies to cultivate a culture of care.
Mandatory workplace civility training was implemented for leaders and employees, with plans to incorporate this training into the onboarding process. Additional initiatives included:
- Leadership Community of Practice (CoP) session on building relationships and trust.
- Development of the Internal Disclosure Dashboard.
- Development of a placemat for addressing misconduct or workplace concerns.
- Pilot training on Working Minds for Managers.
Supporting Advancement: To advance the careers of Indigenous employees and other designated groups, the CER implemented various initiatives building on the D&B Roadmap recommendations. These initiatives included leadership coaching sessions launched in January 2024, focusing on a range of in-demand career development topics, including:
- Career development strategies for growth within and beyond the CER.
- Equipping employees with skills for leadership positions.
- Navigating career advancement within the public sector.
Additionally, the CER participated in the Canada School of Public Service Aspiring Director Program. Two employees are currently in the second phase of this three-phase developmental program, with completion expected in September 2024. The CER also consistently participates in the Treasury Board of Canada’s Mosaic Leadership Development Program. In 2024, one employee qualified for this eighteen-month program. The Learning and Development plan templates were revamped to support the upcoming Accountability Setting process. Workshops on career development were held with staff, the Leadership Community of Practice, and the Technical Leadership Community of Practice. Additionally, all CER employees have access to free in-house French language training as part of their professional development opportunities.
Diversifying Recruitment: Targeted recruitment strategies were implemented to attract qualified candidates from diverse backgrounds, with a particular focus on Indigenous Peoples, visible minorities, and people with disabilities. The IRRAS, approved in May 2024, will be implemented through the CER Strategic Plan for 2024-2027. To complement these efforts, leaders received training on conducting stay interviews to gain valuable insights into employee experiences and identify potential areas for improvement in recruitment and retention.
The close-out progress report of the D&B Roadmap indicated that 95% of the recommendations are implemented: Address Misconduct 92%, Support Advancement 100%, and Diversify Recruitment 94%. Only four out of 76 tasks indicated in the D&B Roadmap are outstanding and these are:
- Develop a visual/placemat depicting various ways employees and leaders can address or deal with misconduct or workplace complaints.
- Examine the role of a diversity and inclusion commissioner.
- Formalizing diverse hiring boards through implementing an HR staffing system.
- Implementing HR systems for robust data.
3. Building an Accessible Workplace
The CER is taking significant strides towards an inclusive and accessible workplace for all employees. With the implementation of 11 out of 31 recommendations from the CER Accessibility Plan and ongoing progress on the remaining recommendations (ranging from 25% to 75% completion), the CER is aligned with the Accessible Canada Act (ACA). This comprehensive plan builds upon the foundation laid by the 2022 D&B Roadmap, ensuring that accessibility is a core principle woven into every aspect of the CER's operations.
BUILDING MOMENTUM FOR FUTURE SUCCESS
The past year has been marked by impactful achievements:
- Appointment of Accessibility Champion: The establishment of the Accessibility Champion Role spearheads accessibility initiatives within the CER, fostering a culture of inclusion.
- Leadership Accountabilities: Accessibility considerations are now integrated into Leadership Accountabilities and performance management, fostering accountability at all levels.
- Accessibility Passport for Workplace Accommodations: The Accessibility Passport was implemented with clear communication of accommodation processes and simplified procedures for obtaining workplace accommodations, empowering employees with disabilities to confidently navigate support systems.
- Collaboration Strengthens Accessibility: Collaboration with the Accessibility, Accommodation, and Adaptive Computer Technology (AAACT) program at Shared Services Canada ensures all employees have access to the tools and support they need to thrive in an accessible work environment.
- Accessible Digital Presence: The CER Information and Communication Technology (ICT) team is committed to enhancing accessibility across its digital landscape. By ensuring all new online content, including the CER's website, intranet, and internal systems, complies with the Web Content Accessibility Guidelines (WCAG 2) standards, we strive to make digital products accessible to all users. Integrating accessibility practices and testing into every phase of the product lifecycle ensures a foundational commitment to inclusivity from the start. Investments in resources, automated progress tracking, and capacity building support these efforts, enabling every employee to fully engage with our technology.
- Accessible Procurement: Integrating accessibility into procurement processes ensures we acquire equipment and services that are inclusive by design. Mandatory training, including vital privacy considerations, equips staff to make informed decisions.
ONGOING COMMITMENTS
The CER remains dedicated to advancing accessibility through continuous improvement and collaboration. Future efforts will focus on:
- Hybrid Work Model and Accessibility: Integrating accessibility considerations into the evolving hybrid work model, including the Accessibility Passport program.
- Empowering Through Education: Ongoing accessibility training programs equip all employees with the knowledge and skills to create a truly inclusive environment.
- Mainstreaming Accessibility: Accessibility considerations will be embedded into the development, implementation, and review of all CER programs, policies, and processes.
- Infrastructure Enhancements: Upgrading physical workspaces and facilities to ensure they are fully accessible to all employees, including those with disabilities.
- Disability Inclusion Takes Center Stage: We prioritize the hiring, promotion, and retention of employees with disabilities, further enriching our diverse workforce.
By prioritizing accessibility in every facet of its operations, the CER is not only complying with legislative requirements but also creating a workplace where all employees can thrive.
4. Enhancing Employment Equity: Ongoing Efforts
The CER acknowledges the importance of addressing ongoing gaps in employment equity representation. Here is an overview of our progress:
- Self-Identification Campaign: The 2024 self-identification campaign yielded positive results, significantly reducing the overall employment equity gap for people with disabilities to 7.7% compared to a workforce availability of 8.7%. The gap for visible minorities was eliminated, achieving a representation of 23.8% compared to a workforce availability of 23.5%. Additionally, the representation of Indigenous Peoples was sustained at 4.2%, compared to a workforce availability of 2.6%. This improved data collection allows the CER to tailor programs and resources more effectively.
- Unconscious Bias Training: Continued focus on unconscious bias training for all employees, with a particular emphasis on leaders, aims to mitigate bias in recruitment, promotion, and development opportunities.
- Diverse Hiring Boards: The CER actively promotes diverse hiring boards to ensure a wider range of perspectives are considered during the selection process.
- Enhanced use of the Federal Student Work Experience Programs: Programs such as the Federal Student Work Experience Program, the Employment Opportunity for Students with Disabilities, and the Indigenous Student Employment Opportunity are used for recruiting employees from equity-deserving groups. Recruited students from these programs for summer and fall campaigns provide work opportunities and valuable experience in their respective fields of study. To maximize the return on investment in student hires and support organizational renewal, the CER will explore opportunities for bridging eligible students into permanent positions. This approach will contribute to enhancing diversity and representation within the organization while providing career advancement pathways for high-performing students.
- Leveraging Government Initiatives to Advance Black Employees: The CER is committed to supporting the career advancement of Black public servants and is actively engaged in initiatives outlined in the Government of Canada's Action Plan to support Black public servants. Building on the success of existing programs like the Mosaic Leadership Development Program and the Aspiring Director Program, the CER will capitalize on the following new initiatives:
- Executive Leadership Program: The CER will support Black executives in EX-01, EX-02, and EX-03 levels through participation in the new executive leadership program offered by the Canada School of Public Service.
- Individualized Support: The CER will leverage the Public Service Commission's expanded assessment, counselling, and coaching services to provide tailored support for Black public servants in their career development.
- Launched the Reconciliation and Diversity, and Inclusion Awards to recognize and celebrate individuals or teams who significantly contribute to reconciliation and EDI initiatives.
- Implement Long-term Hybrid Workplace Approach: Phase III of the Hybrid Workplace Initiative has been executed, including the first year of the new Telework Policy and Hybrid Work Guidelines.
These initiatives, alongside ongoing efforts detailed in related subsections, demonstrate the CER's commitment to achieving a workforce that reflects the diversity of Canada.
5. Fostering a Culture of Inclusion and Investing in Learning and Development
Building an inclusive workplace requires ongoing engagement, awareness initiatives, and continuous learning and development. The CER is committed to fostering a sense of belonging and empowering its workforce through the following efforts:
- Development of an Organizational Citizenship Model: Designed with employees for employees, this model provides a structure for employees to actively engage, connect with one another, lead specific activities, and be recognized for their contributions to a positive workplace culture. The model defines three levels of formality: employee-led groups, support to programs, and direct participation in programs.
- Employee Resource Groups (ERGs): Active ERGs such as the Indigenous Advisory Committee, Black Employee Network, Mental Health Committee, and the Equity Network (merging the Persons with Disabilities Committee and 2SLGBTQI+ Network) offer platforms for employees to connect, share experiences, and propose solutions related to EDI topics.
- Collaboration and Feedback: Regular Kitchen Café sessions and other opportunities encourage employee participation in EDI initiatives through feedback and discussions.
- Employee Surveys: Regular pulse surveys help gauge employee perceptions and identify areas for improvement in the EDI space.
- Indigenous Cultural Intelligence Training: Training courses on Indigenous Cultural Safety and Humility, and Transformational Leadership were offered to CER employees, emphasizing the importance of long-term strategic efforts in decolonization.
- Civility Training: In response to concerns regarding discrimination, harassment, and belonging, the CER implemented civility training as part of the D&B Roadmap recommendations.
- Diversity and Inclusion Workshops: Workshops covering key EDI topics such as unconscious bias, cultural competence, and inclusive leadership were organized. These workshops provided employees with opportunities to learn, reflect, and engage in discussions that challenge biases and promote inclusive practices.
- Online Learning Modules: Through platforms like the Canada School of Public Service and CER's electronic learning and performance management system, employees can access a variety of EDI-focused online learning modules for selfpaced learning, enhancing their knowledge and skills related to EDI.
- Awareness Campaigns: Using various communication channels (posters, emails, iWeb, and social media), the CER conducts awareness campaigns to promote important EDI issues and observances throughout the year. Groups such as the Diversity and Belonging Team, Indigenous Employee Circle, Mental Health Committee, Equity Network and Black Employee Network lead campaigns focused on specific EDI issues or observances, such as National Accessibility Week, National Black History Month, Pride Month, and International Women's Day.
Through these comprehensive initiatives, the CER empowers its workforce to actively contribute to EDI goals, fostering an inclusive and supportive environment where all employees feel valued, respected, and motivated to drive positive change. These efforts underscore the CER’s unwavering commitment to eradicating bias, barriers, and discrimination, ensuring equal opportunities and a true sense of belonging for all employees.
6. Enhancing Data Collection and Analysis
Accurate data collection and analysis are essential for measuring progress and identifying areas for improvement in EDI efforts. The CER is enhancing its data capabilities through:
- Workforce Demographics: Regular analysis of workforce demographics to ensure representation aligns with labour market availability.
- Employee Surveys: Using data from employee surveys to identify trends, areas for improvement, and the effectiveness of EDI initiatives.
- EDI Metrics: Developing and tracking EDI metrics to assess the impact of initiatives and inform future strategies.
ONGOING EFFORTS
- Implementing robust data collection systems to track employee demographics and monitor progress towards EDI goals.
- Using insights from data analysis to inform decision-making and ensure continuous improvement in EDI efforts.
Conclusion
The CER remains steadfast in its commitment to enhancing equity, diversity, and inclusion and Reconciliation within the organization. Through comprehensive strategies, ongoing initiatives, and a commitment to continuous improvement, the CER is fostering a workplace where every employee feels valued, respected, and included. The progress made in 2023-24 sets a strong foundation for future efforts, and the CER will continue to prioritize EDI in all aspects of its operations.
Workforce Analysis
A purpose of the workforce analysis is to identify areas of under-representation of designated group members (women, Indigenous Peoples, persons with disabilities, and visible minorities) in the CER's workforce. This analysis compares the number of employees from these designated groups within various occupational groups to estimate whether it reflects the qualified and available workforce in reasonable geographic recruitment areas. As mandated by the Employment Equity Act, this process helps us develop strategies to promote diversity and inclusion.
The analysis is generated using the Workplace Equity Information Management System (WEIMS) module provided by Employment and Social Development Canada (ESDC). WEIMS offers a streamlined approach to generating accurate workforce analyses.
Data Sources
The analysis utilizes various data sources to gather information about the CER's workforce composition. These sources provide valuable insights into the representation of designated groups and support the development of diversity and inclusion initiatives.
- MyGCHR 9.1: This standardized Human Resources Management System employed by the Government of Canada serves as the primary data source for workforce analysis.
- Self-Identification Data: The CER encourages voluntary self-identification through MyGCHR, allowing employees to identify as belonging to designated groups. This data, while respecting individual autonomy and privacy, is crucial for accurate representation and assessing progress towards diversity and inclusion goals.
- Gender Information: Gender data is collected from hiring documents and entered into MyGCHR by Human Resources. This data allows us to assess the representation of women within the workforce.
By utilizing these data sources and respecting voluntary self-identification, the CER generates comprehensive workforce analysis reports that inform evidence-based decision-making for targeted diversity and inclusion initiatives. These insights enable us to track progress, identify representation gaps, and implement effective measures to promote a diverse and inclusive workforce.
EMPLOYEE POPULATION
This analysis examines the core employee population at the CER, excluding individuals working less than 12.5 hours per week, Governor-in-Council Appointees, Interchange Personnel, short-term Employees/Casuals, Students, and Contractors. The workforce data included in the report encompasses indeterminate employees and employees with service terms of three months or more in substantive positions. This focused approach provides targeted insights into the representation of designated groups within the CER and informs our diversity and inclusion initiatives.
Data Source: This report utilizes data from the 2016 census, which is the current standard within the WEIMS. We acknowledge that this data may not fully reflect the most recent demographics. Employment and Social Development Canada is actively working to update WEIMS with the 2021 census data. Once this update is complete, future reports will be based on the most current information.
KEY UPDATES BASED ON 2023-24 DATA
- Total Employees: Currently at 596.
- Women: Comprising 65.3% of the workforce.
- Indigenous Peoples: Representing 4.2% of the workforce.
- Visible Minorities: Representing 23.8% of the workforce.
- Persons with Disabilities: Representing 7.7% of the workforce.
POSITIVE IMPACT OF SELF-DECLARATION DATA AND SELF-IDENTIFICATION CAMPAIGN
The significant improvements in representation across several designated groups, particularly for visible minorities and people with disabilities, can be attributed in part to the successful implementation of the self-declaration data and self-identification campaign completed in 2023 and 2024. This initiative has provided the CER with more accurate data on the composition of its workforce, allowing for a more focused approach to achieving employment equity, diversity and inclusion goals.
OVERALL REPRESENTATION
In the fiscal year 2023–24, the CER had a total of 596 employees across its headquarters in Calgary and three regional offices located in Vancouver, Montreal, and Yellowknife (Table 1). This represents a slight increase of ten employees compared to the previous year (586 employees in FY 2022-23). The CER workforce is comprised of highly qualified professionals with diverse academic backgrounds and experiences. They contribute their expertise and skills across the organization's 12 employment equity occupational groups (EEOGs). The distribution of the employee population among different provinces is based on the designated office location for each employee as recorded in MyGCHR, which is the primary human resources management system used by the CER.
Distribution by Province:
- Alberta: The majority of employees (581) have a designated work location in Alberta. This includes 381 women, 141 visible minorities, 25 Indigenous Peoples, and 46 people with disabilities.
- British Columbia: The British Columbia regional office currently employs six employees. Of these, four are women. There are currently no employees who identify as Indigenous Peoples or persons with disabilities in this office.
- Quebec: The Quebec regional office currently employs nine employees. Of these, four are women. According to the table, there are no employees who identify as visible minorities, Indigenous Peoples, or persons with disabilities in this office.
Table 1: Designated Group Distribution by Province with Rounded Percentages and data Suppression for employee privacy
Province |
Total number of Employees |
Women (%) |
Visible Minorities (%) |
Indigenous Peoples (%) |
Person’s w/ Disabilities (%) |
|---|---|---|---|---|---|
Alberta |
581 |
66 |
24 |
4 |
8 |
British Columbia |
6 |
67 | 17 |
||
Quebec |
9 |
44 |
|||
Total |
586 |
387 |
117 |
25 |
8 |
Note: Employment Equity Representation data as of March 31, 2024. |
|||||
Figure 1: Designated Group Distribution by Province
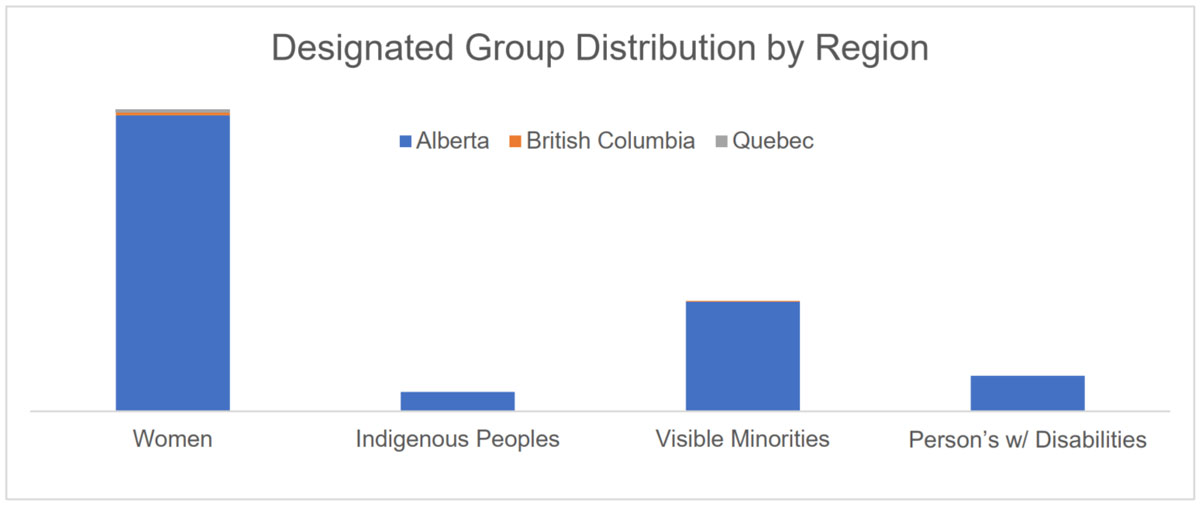
Understanding Workforce Distribution:
Table 1 and Figure 1 provide a detailed breakdown of employee distribution by designated group and province within the CER. As shown in Table 1, the Quebec and British Columbia offices currently have no employees identified as visible minorities, Indigenous Peoples, or persons with disabilities. Given the small size of our workforce in regional offices, achieving a perfectly balanced distribution may be challenging. However, we can actively seek to recruit from designated groups when vacancies arise in these locations to promote a more equitable geographic representation. The CER can leverage this data to develop focused recruitment strategies to attract qualified candidates from these designated groups for its regional offices, when recruitment opportunities arise.
Enhancing Employment Equity Representation
To further strengthen our understanding of representation gaps across regions, the CER will continue to analyze workforce distribution data over time and in conjunction with other relevant information, such as total employees per province and labour market availability data. This data-driven approach will inform the development and implementation of strategies to achieve a more geographically balanced and representative workforce across all designated groups.
Employment Equity Representation
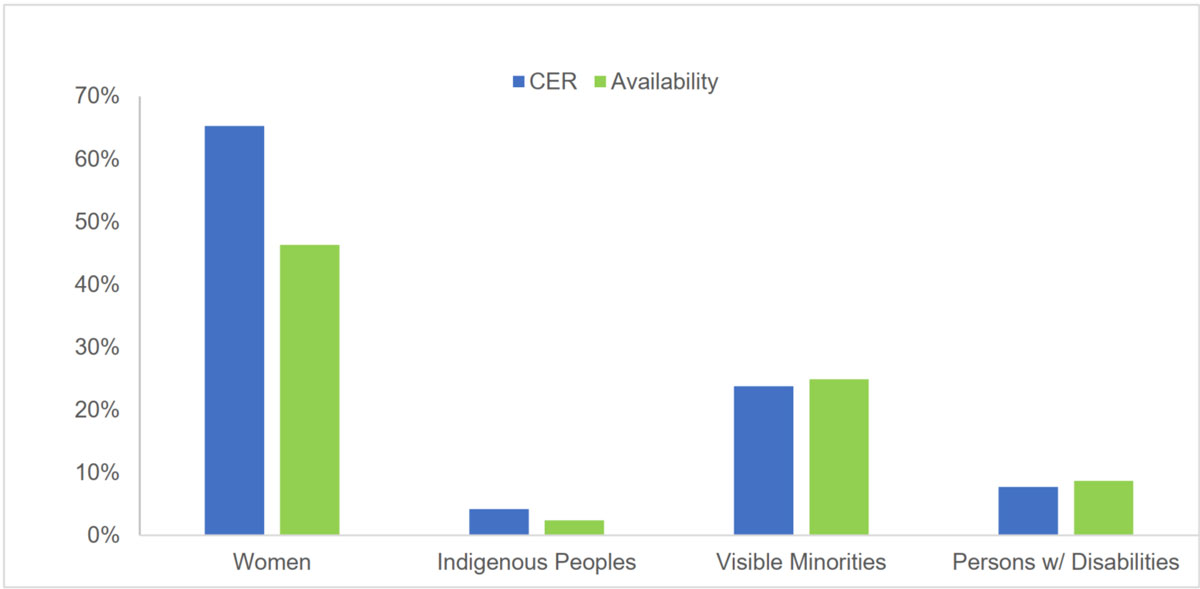
The CER evaluates its progress in employment equity by comparing its workforce demographics to LMA. LMA reflects the qualified individuals from designated groups available in the labour market for specific occupations.
Positive Developments
This report demonstrates progress in achieving equitable representation. As shown in Table 2 and Figure 2, the representation of women (65.3%) has surpassed LMA (46.1%). The CER has also sustained its representation of Indigenous Peoples (4.2%) above LMA (2.6%) compared to the previous year. Additionally, there has been a continued increase in the representation of visible minorities (23.8%) across several occupational groups, nearing LMA (23.5%).
Table 2: CER’s Employment Equity Representation
Employment Equity Representation (%) (Fiscal Year 2023-24) |
||
|---|---|---|
Designated Group |
CER |
Labour Market Availability |
Women |
65.3% |
46.1% |
Indigenous Peoples |
4.2% |
2.6% |
Visible Minorities |
23.8% |
23.5% |
People with disabilities |
7.7% |
8.7% |
Note: Employment Equity Representation data as of March 31, 2024. |
||
Figure 2: Employment Equity Representation 2023-24
Note: Employment Equity Representation data as of March 31, 2024.
Graphic description
See Table 2 above.
Areas for Continued Focus
While these results are encouraging, the CER acknowledges the need for further progress in achieving equitable representation for all designated groups. The representation of people with disabilities (7.7%) remains below LMA (8.7%).
Key Initiatives
Initiatives like the 2023 self-identification campaign and leveraging self-declaration data have significantly enhanced CER's ability to accurately assess workforce demographics. This allows us to target future employment equity efforts strategically, addressing gaps in representation across all designated groups and occupational categories. These efforts will continue to focus on:
- Indigenous Peoples and Visible Minorities: Closing the leadership gap through targeted development programs, mentorship initiatives, and reviewing promotion processes for fairness and inclusivity.
- People with Disabilities: Increasing representation by partnering with disability rights organizations, ensuring accessible recruitment materials, providing reasonable accommodations, and offering training for managers on supporting employees with disabilities.
Fiscal Year 2023-24 Highlights
- Launched a targeted recruitment campaign focused on attracting qualified candidates from underrepresented groups in senior management and professional occupations.
- Rolled out unconscious bias training for all hiring managers.
Confidence in the Future
The CER remains confident that by continuing to monitor progress, implement targeted initiatives, and foster a culture of inclusion, it can achieve a workforce that is truly representative of Canada's diverse talent pool.
Employment Equity Representation Year Over Year
Over the past decade (FY 2014-15 to FY 2023-24), Table 3 and Figure 3 track how well the CER reflects Canada's diversity. It compares the number of women, Indigenous Peoples, visible minorities, and people with disabilities in the CER's workforce to their availability in the national job market.
Table 3: Employment Equity Representation (Year over Year)
Employment Equity Representation vs Labour Market Availability (LMA) (Year over Year) |
||||||||
|---|---|---|---|---|---|---|---|---|
Year |
Women |
Indigenous People |
Visible Minority |
Persons with Disability |
||||
CER |
LMA |
CER |
LMA |
CER |
LMA |
CER |
LMA |
|
FY14–15 |
254 |
222 |
18 |
5 |
60 |
75 |
15 |
19 |
FY15–16 |
272 |
222 |
19 |
5 |
65 |
75 |
15 |
19 |
FY16–17 |
309 |
234 |
22 |
8 |
76 |
99 |
26 |
17 |
FY17–18 |
321 |
234 |
26 |
8 |
57 |
99 |
22 |
17 |
FY18–19 |
326 |
253 |
25 |
12 |
61 |
111 |
22 |
44 |
FY19–20 |
334 |
260 |
25 |
14 |
62 |
116 |
21 |
46 |
FY20–21 |
348 |
255 |
22 |
13 |
69 |
137 |
18 |
47 |
FY21–22 |
364 |
257 |
20 |
15 |
68 |
129 |
18 |
47 |
FY22–23 |
387 |
272 |
25 |
15 |
117 |
135 |
35 |
51 |
FY23–24 |
389 |
277 |
25 |
15 |
142 |
140 |
46 |
52 |
Figure 3: Employment Equity Representation Year Over Year
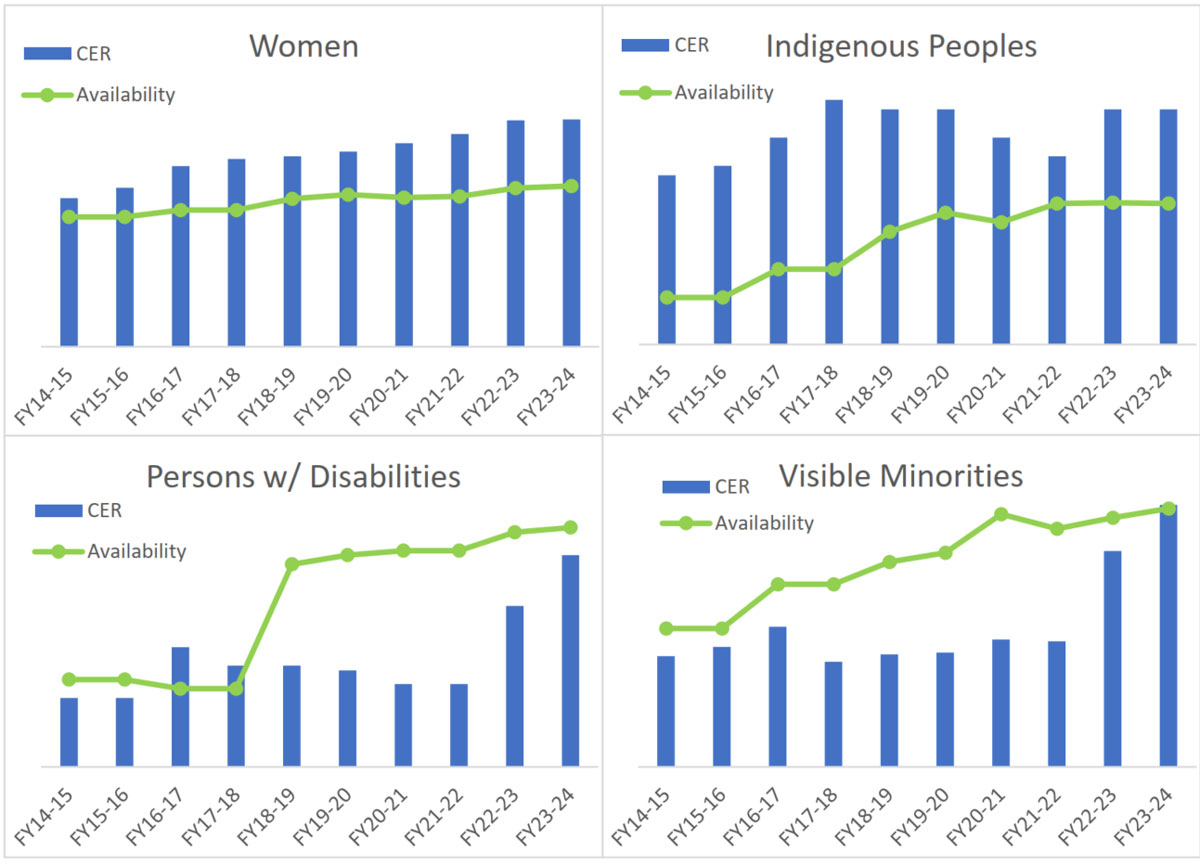
Graphic description
See Table 3 above.
Employment Equity Progress at the CER (FY 2023-24)
The CER remains committed to achieving greater employment equity for designated groups. This section highlights the progress made in fiscal year 2023-24 compared to the previous year. It's important to note that our annual self-identification campaign has played a significant role in reducing the gap in representation across designated groups over the past two years.
POSITIVE DEVELOPMENTS:
- Women: Women continue to be well-represented at the CER, exceeding the national LMA of 277 with 389 employees, up from 387. This commitment to gender inclusion fosters a diverse and successful work environment.
- Indigenous Peoples: The CER maintains a steady representation of Indigenous Peoples, with 25 employees identifying as such. This remains above the national LMA of 15 employees.
- Visible Minorities: The representation of visible minorities has seen a notable increase, reaching 142 employees, up from 117 – surpassing the national LMA of 140. This positive trend signifies progress towards a truly diverse workforce.
AREAS FOR CONTINUED IMPROVEMENT:
While the CER acknowledges these achievements, there's room for further progress.
People with Disabilities: The number of employees with disabilities at the CER has increased to 46 from 35. While this represents progress, the gap of six employees compared to the national LMA of 52 remains a focus. The CER is committed to developing and implementing strategies to attract, retain, and promote qualified individuals with disabilities.
MOVING FORWARD: BUILDING A TRULY INCLUSIVE AND REPRESENTATIVE WORKFORCE
The CER recognizes the vital role it plays in working collaboratively with Indigenous Peoples in the energy sector, particularly with the implementation of the IRRAS. To achieve this collaboration and ensure equitable representation across all designated groups, the CER is committed to implementing focused strategies and continuously monitoring progress.
TARGETED STRATEGIES:
- Indigenous Peoples: Develop and implement a comprehensive Indigenous workforce strategy to enhance recruitment, retention, and advancement. Focus on building strong relationships with Indigenous communities, educational institutions, and professional organizations. Address potential barriers faced by Indigenous applicants and ensure culturally appropriate practices throughout the employee lifecycle.
- Visible Minorities and Black Employees: Conduct a comprehensive analysis of leadership recruitment, promotion, and retention practices to identify and address any unconscious bias that hinders advancement to leadership positions. Partner with relevant professional organizations and educational institutions to build targeted recruitment pipelines for visible minorities and Black employees. Develop and implement mentorship and sponsorship programs specifically designed to support their career development within the CER, with a strong focus on leadership roles.
- People with Disabilities: Conduct accessibility audits of the physical work environment, recruitment materials, and online platforms to remove barriers for applicants and employees with disabilities. Partner with disability rights organizations to develop targeted recruitment strategies and raise awareness of career opportunities at the CER. Provide training for managers and supervisors on creating a more inclusive work environment and offer reasonable accommodations throughout the hiring process and employment.
- All Designated Groups: Regularly analyze recruitment, promotion, and retention practices to identify and address any potential barriers for all designated groups. Develop and implement inclusive mentorship and sponsorship programs specifically designed to support career development within the CER across all levels.
CONTINUOUS MONITORING AND IMPROVEMENT:
The CER will continuously monitor progress through data analysis, employee surveys, and focus group discussions with representatives from all designated groups. This data will be used to identify areas for further improvement, ensure the effectiveness of implemented strategies, and adjust the approach as needed. Building a diverse and inclusive workforce that reflects the Canadian population and fosters strong relationships with Indigenous communities is essential for the CER's success.
EMPLOYMENT EQUITY REPRESENTATION IN VARIOUS OCCUPATIONAL GROUPS
Table 4 provides a detailed breakdown of the CERs employee population for the fiscal year 2023-24. The data is categorized by gender, designated groups (women, Indigenous Peoples, visible minorities, persons with disabilities), and EEOGs. The table presents both the number of employees within each category and their corresponding percentage of the total workforce.
Table 4 – Employment Equity Summary by Employment Equity Occupational Group
Employment Equity |
Total |
Men |
Women |
Indigenous Peoples |
Visible Minorities |
Persons |
|||||
|---|---|---|---|---|---|---|---|---|---|---|---|
CER |
2016 Census |
CER |
2016 Census |
CER |
2016 Census |
CER |
2016 Census |
CER |
2016 Census |
||
01: Senior Managers |
18 |
7 |
10 |
11 |
5 |
0 |
1 |
||||
38.9% |
72.4% |
61.1% |
27.6% |
0.0% |
3.2% |
||||||
02: Middle Managers |
36 |
16 |
19 |
20 |
15 |
7 |
7 |
2 |
|||
43.2% |
60.6% |
55.6% |
39.4% |
18.9% |
17.6% |
||||||
03: Professionals |
392 |
146 |
167 |
246 |
163 |
15 |
8 |
90 |
101 |
28 |
35 |
37.2% |
58.4% |
62.8% |
41.6% |
3.8% |
2.1% |
23.0% |
25.8% |
7.1% |
8.9% |
||
04: Semi-professionals & Technicians |
39 |
16 |
24 |
23 |
13 |
5 |
8 |
5 |
3 |
||
41.0% |
67.0% |
59.0% |
33.0% |
12.8% |
19.4% |
12.8% |
7.6% |
||||
05: Supervisors |
5 |
4 |
3 |
0 |
0 |
0 |
1 |
0 |
1 |
||
80.0% |
55.5% |
0.0% |
3.9% |
0.0% |
24.0% |
0.0% |
27.5% |
||||
07: Administrative & Senior Clerical |
33 |
4 |
10 |
29 |
27 |
11 |
5 |
||||
12.1% |
17.6% |
87.9% |
82.4% |
33.3% |
16.4% |
||||||
10: Clerical Personnel |
71 |
15 |
17 |
56 |
49 |
27 |
16 |
5 |
7 |
||
21.1% |
31.3% |
78.9% |
68.7% |
38.0% |
21.9% |
7.0% |
9.3% |
||||
11. Intermediate Sales and Service Personnel |
1 |
0 |
0 |
0 |
0 |
0 |
0 |
||||
0.0% |
4.5% |
0.0% |
25.4% |
0.0% |
10.8% |
||||||
12: Semi-skilled Manual Workers |
1 |
0 |
0 |
0 |
0 |
0 |
0 |
0 |
0 |
||
0.0% |
17.1% |
0.0% |
4.8% |
0.0% |
25.4% |
0.0% |
10.3% |
||||
Total |
596 |
207 |
251 |
389 |
275 |
25 |
15 |
142 |
140 |
46 |
52 |
|
Note: Employment Equity Representation data as of March 31, 2024. |
|||||||||||
KEY OBSERVATIONS:
This year's data allows for a comparison with the statistics from the 2022-23 Employment Equity Report and the 2016 census, highlighting areas of progress and ongoing focus for the CER. Here's a breakdown by EEOG:
Senior Managers: As of March 31, 2024, the CER employed 18 senior managers, up from 14 last year. Of these, 11 were women, exceeding the national LMA of 5. Representation of visible minorities and Indigenous Peoples remains a focus area, with no Indigenous representation and lower representation of visible minorities compared to the 2016 census (one for Indigenous people and two for visible minorities).
- Middle Managers: As of March 31, 2024, there were 36 middle managers, two less than the previous year. Of these, 20 were women, exceeding the national LMA of 15. Indigenous Peoples (data redacted) aligned with the national benchmark. People with disabilities (data redacted) exceeded their LMA of two, and visible minority representation closely matched the national LMA of seven.
- Professionals: This group includes financial officers, engineers, economists, environmental specialists, HR advisors, communications advisors, information systems specialists, translators, and lawyers, totaling 392 employees, up from 384 last year. Women (246) continue to be well-represented, exceeding the national LMA of 163. Representation of Indigenous Peoples (15) also exceeds the national LMA of eight. However, visible minorities (90) and people with disabilities (28) remain underrepresented compared to their respective national LMAs of 101 and 35.
- Semi-professionals and Technicians: This group consists of 39 individuals, unchanged from last year, including engineering inspectors, library technicians, IT service analysts, and graphic designers. Women (23) significantly exceed their LMA of 13. Indigenous Peoples (data redacted) aligns with the national LMA. People with disabilities (five) remain well above their national LMA of three, while visible minority representation (five) is lower than the national LMA of eight.
- Supervisors: This group consists of five employees, unchanged from last year. Women (four) are well-represented, exceeding the national LMA of three. However, there is no representation of visible minorities, people with disabilities, or Indigenous Peoples.
- Administrative and Senior Clerical: The Administrative and Senior Clerical group consists of employees belonging to business unit administrators, human resources assistants, and other senior-level administrative staff. This group employs 33 people, down from 36 last year. Women (29) remain wellrepresented, exceeding the national LMA of 27. Visible minority representation (11) is also well above the national LMA of five. Data for Indigenous Peoples and people with disabilities is redacted due to the inclusion of three or fewer individuals.
- Clerical Personnel: This group consists of 71 people, including procurement analysts, digital data coordinators, support technicians, record clerks, mail clerks, and general administrative assistants. Women (56) are well-represented, exceeding the national LMA of 27. Data for Indigenous Peoples is redacted. Visible minorities (27) exceed their national LMA of 16, while people with disabilities (five) are slightly underrepresented compared to the national LMA of seven.
Intermediate Sales and Service Personnel & Semi-Skilled Workers: Due to the small number of employees in these categories, we cannot disclose the gender identity or any other designated group information to maintain confidentiality.
CONCLUSION:
By comparing the 2023-24 data to previous years and the 2016 census, we can see how well the CER is doing in terms of employment equity. While there are positive signs for women, Indigenous Peoples, and visible minorities within some specific EEOGs, we still need to do more to attract and retain Indigenous Peoples, visible minorities, and people with disabilities in different EEOGs job roles.
Representation in Hiring, Promotions, and Departures by Designated Group
Table 5 provides a detailed breakdown of the CER's workforce activity for designated groups in fiscal year 2023-24. This includes the number and percentage of employees from each designated group (women, Indigenous Peoples, visible minorities, and persons with disabilities) who were hired, promoted, and terminated during the year.
Table 5: Total Hires, Promotions and Departures by Designated Group
Designated Group |
Total Hires - 39 |
Total Promotions - 28 |
Total Departures - 14 |
|||
|---|---|---|---|---|---|---|
# |
% |
# |
% |
# |
% |
|
Women |
21 |
43.6% |
21 |
75.0% |
9 |
64.3% |
Indigenous Peoples |
||||||
Visible Minorities |
14 |
35.9% |
9 |
32.1% |
4 |
28.6% |
People with Disabilities |
0 |
0.0% |
||||
|
Note: Employment Equity Representation data as of March 31, 2024. |
||||||
HIRING:
- Women: Women continue to be well-represented in new hires, comprising 43.6% of all new hires. This exceeds their overall representation in the workforce but is lower than the previous year's rate of 63.8%.
- Visible Minorities: Visible minorities also saw a significant representation in new hires, comprising 35.9%. This represents a notable increase of 14.6% compared to the previous year's level of 21.3%.
- Indigenous Peoples: The hiring of Indigenous Peoples decreased slightly to 2.6% from the previous year's rate of 6.4%.
- Persons with Disabilities: The hiring of persons with disabilities increased slightly to 2.6% from the previous year's rate of 2.1%.
PROMOTIONS:
- Women: Women received the majority of promotions, accounting for 75.0% of all promotions. This represents a significant improvement compared to the previous year, when women accounted for 51.9% of promotions.
- Visible Minorities: Visible minorities also received a notable portion of promotions, comprising 32.1% of all promotions. This is an increase from the previous year's rate of 25.9%.
- Indigenous Peoples: The promotion rate for Indigenous Peoples saw a significant increase, rising from 0.0% in the previous year to 10.7% in the current year.
- People with Disabilities: The promotion rate for people with disabilities decreased slightly from 7.4% in the previous year to 7.0% in the current year.
DEPARTURES:
- Women: Women accounted for a significant portion of departures, comprising 63.8% of all departures. This represents an increase from the previous year's rate of 50.0%. While the reasons for departure are not available, this information can be used alongside future data to identify potential retention gaps.
- Visible Minorities: Visible minorities also saw an increase in departures, comprising 21.3% of all departures. This is up from the previous year's rate of 12.5%.
- Indigenous Peoples: The departure rate for Indigenous Peoples remained relatively stable at 6.4% in the current year, compared to 6.3% in the previous year.
- Persons with Disabilities: The departure rate for persons with disabilities increased to 2.1% in the current year from 0.0% in the previous year.
CONCLUSION: The data in Table 5 shows positive progress in attracting and promoting women and visible minorities at the CER. However, there is still room for improvement in representing Indigenous Peoples, visible minorities, and people with disabilities, particularly in hiring and promotions.
Remuneration by Designated Group (FY 2023-24): A Focus on Equity and Trend Analysis
Table 6 and Figure 4 present the salary distribution across designated groups (women, Indigenous Peoples, visible minorities, and persons with disabilities) within the CER. It provides the percentage of employees from each group within five salary ranges.
Table 6: Salary Ranges by Designated Group
Salary Ranges |
Gender |
Indigenous Peoples |
Visible Minorities |
People with disabilities |
||||
|---|---|---|---|---|---|---|---|---|
Women |
Men |
Indigenous |
Non-Indigenous |
Visible Minority |
Non-visible Minority |
Disabled |
Non-Disabled |
|
$50,000 – $74,999 |
84.5% |
15.5% |
5.2% |
94.8% |
30.9% |
69.1% |
6.2% |
93.8% |
$75,000 – $99,999 |
69.8% |
30.2% |
6.9% |
93.1% |
38.8% |
61.2% |
5.2% |
94.8% |
$100,000 – $149,999 |
58.6% |
41.4% |
3.1% |
96.9% |
17.4% |
82.6% |
8.6% |
91.4% |
$150,000 – $199,999 |
66.7% |
68.8% |
31.3% |
6.3% |
37.5% |
62.5% |
12.5% |
87.5% |
$200,00+ |
58.8% |
41.2% |
0.0% |
100.0% |
0.0% |
100.0% |
11.8% |
88.2% |
Note: Employment Equity salary data as of March 31, 2024. |
||||||||
Note: Employment Equity Salary data as of March 31, 2024
Figure 4: Salary Ranges for Designated Groups
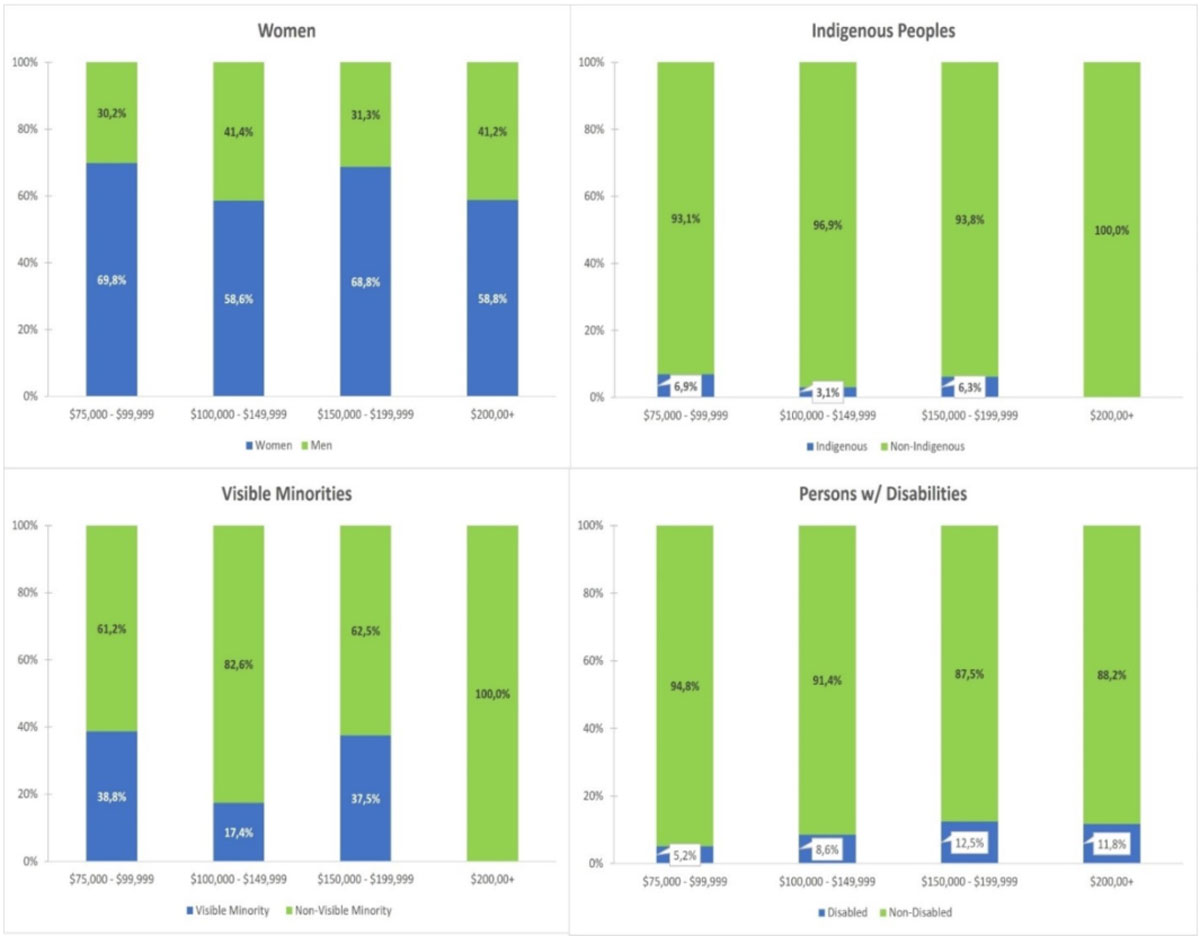
KEY OBSERVATIONS:
Overall Gender Balance: Despite fluctuations, the data suggests a relatively balanced distribution of women and men across most salary ranges. This aligns with the overall gender representation at the CER.
Representation Gaps: There are representation gaps for Indigenous Peoples, visible minorities, and people with disabilities in higher salary ranges (particularly above $100,000). This trend remains consistent with the findings from the previous year's report. For instance, the gap is even wider this year with no Indigenous Peoples represented in the highest salary range ($200,000+).
Women Representation: As shown in Table 7, women's representation has increased in the $75,000-$99,999, $100,000-$149,999, and $150,000-$199,999 salary ranges, and decreased in the $50,000-$74,999 and $200,000+ ranges.
Table 7: Changes in Salary Range Distribution by Gender (2022-23 vs. 2023-24)
Salary Ranges |
Women 2022-23 |
Women 2023-24 |
Change |
Men (2022-23) |
Men (2023-24) |
Change |
|---|---|---|---|---|---|---|
$50,000 – $74,999 |
87.20% |
84.50% |
-2.70% |
12.80% |
15.50% |
+2.7%% |
$75,000 – $99,999 |
67.30% |
69.80% |
+2.5% |
32.70% |
30.20% |
-2.5% |
$100,000 – $149,999 |
58.40% |
58.60% |
+0.2% |
41.60% |
41.40% |
-0.2% |
$150,000 - $199,999 |
66.7% |
68.80% |
+2.1% |
33.30% |
31.30% |
-2.0% |
$200,00+ |
66.70% |
58.80% |
-7.90% |
33.30% |
41.20% |
+7.9% |
Note: Employment Equity salary data as of March 31, 2024. |
||||||
MOVING FORWARD:
To achieve greater equity in remuneration, the CER can consider the following strategies:
- Pay Equity Analysis: Conduct regular pay equity analyses to identify and address any systemic biases in compensation practices.
- Targeted Career Development: Implement programs and participation in development programs (e.g., Mosaic, Executive Leadership Development) to support career development and advancement opportunities for underrepresented groups, potentially leading to higher salary ranges.
Recommendations:
- Conduct a Deeper Analysis: Investigate factors such as job roles, experience, performance evaluations, mentorship opportunities, and unconscious bias to understand the underlying causes of gender disparities.
- Implement Retention Strategies: Develop and implement targeted retention strategies for women in higher-paying roles, including work-life balance initiatives, mentorship programs, and flexible work arrangements.
- Review Hiring and Promotion Practices: Ensure that hiring and promotion processes are fair, transparent, and free from bias. Consider implementing unconscious bias training and using structured interview processes.
- Foster a Supportive Workplace Culture: Create a workplace culture that values diversity, inclusion, and equal opportunities for all employees. This includes promoting a work-life balance, offering mentorship programs, and providing opportunities for professional development.
By addressing these areas, the organization can work towards a more equitable and inclusive workplace where gender balance is maintained across all salary ranges.
Summary, Insights, and Recommendations for Improved Employment Equity at the CER
The CER is actively working to enhance employment equity representation across its occupational groups. This commitment is reflected in initiatives such as the D&B Roadmap, Employment Equity Plan, Accessibility Plan, and IRRAS. These initiatives aim to create a more equitable, diverse, and inclusive environment for all employees.
KEY TAKEAWAYS FROM FY 2023-24:
- The CER is making strides towards a more diverse workforce, as evidenced by the positive advancements in representation for visible minorities, Indigenous Peoples, and people with disabilities across various occupational groups.
- The self-identification campaign continues to be a valuable tool for understanding the composition of the workforce and informing targeted initiatives.
ONGOING CHALLENGES:
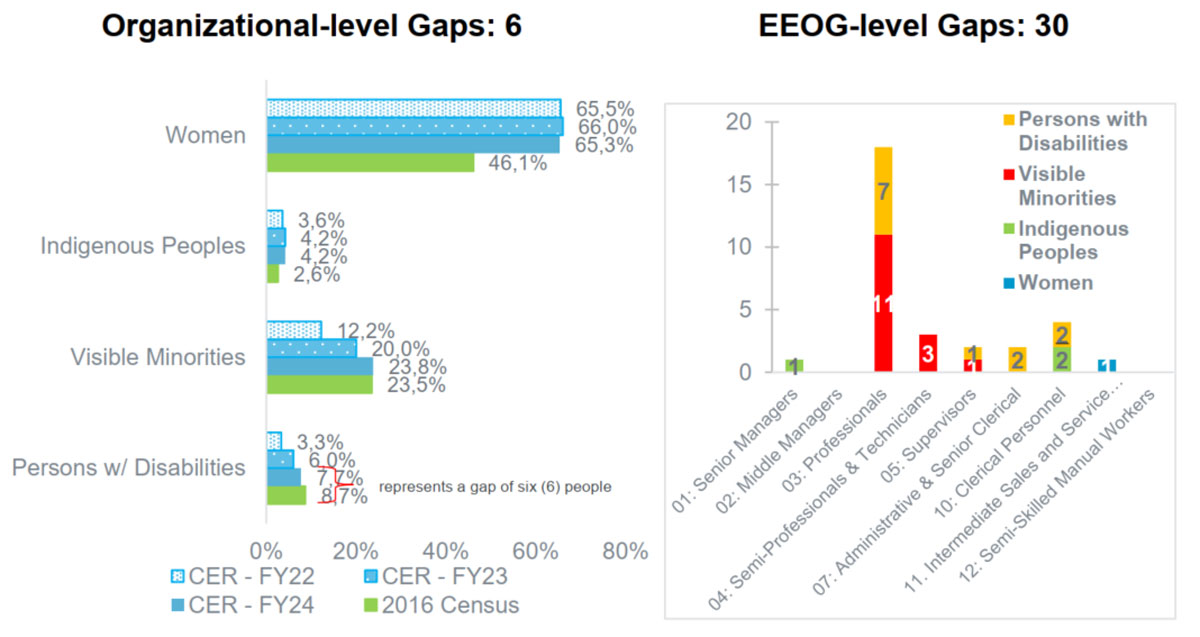
- The underrepresentation of Indigenous Peoples and visible minorities, particularly in leadership roles and specific professions, requires sustained focus, as showed in the graphs below.
- The overall representation gap for people with disabilities at the CER is six. This indicates a disparity between the actual representation and the target representation.
- Occupational-Level Gaps:
- Professionals: The gap for people with disabilities in professional roles is seven, while for visible minorities it's 11.
- Semi-Professionals: The gap for visible minorities in semi-professional roles is three.
- Supervisors: There is a gap of one for both people with disabilities and visible minorities in supervisor positions.
- Senior Clerical: The gap for people with disabilities in senior clerical roles is two.
- Clerical Personnel: The gap for visible minorities in clerical personnel roles is two, as well as for Indigenous Peoples.
- Senior Managers: There is a gap of one for Indigenous Peoples in senior manager positions.
- Addressing the overall representation gap for people with disabilities remains a priority for the CER.
KEY DATA POINTS:
Note: Employment Equity Representation data as of March 31, 2024.
Image Description
The image presents two main sections summarizing Employment Equity Representation gaps as of March 31, 2024.
On the left, titled "Organizational-level Gaps: 6", there is a grouped bar chart showing representation data for four designated groups: Women, Indigenous Peoples, Visible Minorities, and Persons with Disabilities. Three fiscal years of Current Employment Representation (CER) data are shown (FY22, FY23, FY24), along with comparison to 2016 Census data. The values are:
- Women: CER ranges from 65.3% to 66.0% across years, while census shows 46.1%.
- Indigenous Peoples: CER is 3.6%–4.2%, compared to 2.6% census.
- Visible Minorities: CER is 12.2%–23.8%, with a 23.5% census benchmark.
- Persons with Disabilities: CER ranges from 3.3% to 7.7%, compared to 8.7% census.
The chart notes that "gap" values represent differences between the CER and Census data, with the label "*represents a gap of six (6) people*" at the 6-person threshold.
On the right, under "EEOG-level Gaps: 30", a vertical bar chart shows employment equity occupational group (EEOG) gaps across 9 occupational categories. Each bar is color-coded by group:
- Red (Visible Minorities): most prominent gaps, especially in "03: Professionals" with 11 gaps.
- Yellow (Persons with Disabilities): 7 gaps, concentrated in "03: Professionals".
- Other groups show smaller gaps: Women (light blue), Indigenous Peoples (green), and Visible Minorities across other categories such as "10: Clerical Personnel" and "12: Semi-Skilled Manual Workers".
The x-axis lists EEOG groups (e.g., "01: Senior Managers", "03: Professionals", "07: Administrative & Senior Clerical"), and the y-axis shows the count of representation gaps, ranging from 0 to 20.
The x-axis lists EEOG groups (e.g., "01: Senior Managers", "03: Professionals", "07: Administrative & Senior Clerical"), and the y-axis shows the count of representation gaps, ranging from 0 to 20.
A note below the image states: "Employment Equity Representation data as of March 31, 2024."
STRATEGIES FOR ENHANCING EMPLOYMENT EQUITY:
Employee Participation: Building on the success of the self-identification campaign, the CER should continue to encourage employee participation to gain a deeper understanding of the workforce's diversity.
Focused Recruitment: Setting recruitment goals with employment equity focus based on commitments and operational needs.
Leadership Commitment: Leaders to apply an employment equity focus to recruitment aligned with employment equity goals.
Planning and Development: Supporting leaders with guidance, data, and information at the onset of recruitment processes to align operational needs with employment equity commitments.
Tools and Data: Developing and maintaining robust tracking systems and reporting tools to facilitate the provision of timely and accurate information to leaders for planning purposes.
Mentorship and Sponsorship: Expanding mentorship and sponsorship programs specifically designed to support the career advancement of Indigenous Peoples, visible minorities and people with disabilities within the CER.
Evaluation and Improvement: As outlined in the Employment Equity Plan, our initiatives focus on continual improvement of our systems, processes, and tools to align with the identified gaps in our workforce representation and operational needs. This ongoing evaluation will play a crucial role in ensuring that our strategies remain effective and responsive to the evolving needs of our organization.
Employee Engagement: Consultations and Collaboration
This year's report highlights the importance of collaborating with employee groups throughout the development of employment equity initiatives and revisions. The CER recognizes that employee voices are essential in fostering a truly inclusive and equitable work environment, adhering to both the EEA and the organization's Trust and Confidence Strategic Priority objectives.
VALUABLE EMPLOYEE ENGAGEMENT:
The CER actively engaged with various employee groups and committees, including:
- Accessibility Committee
- Mental Health Committee
- Employee Equity Network
- Indigenous Employee Circle
- Indigenous Relations and Reconciliation Business Unit
- Visible Minority – Black Employees Network
- Union representatives
This collaborative approach yielded significant benefits:
- Diverse Perspectives: Employee insights, informed by a range of backgrounds and experiences, provide invaluable guidance on employment equity challenges and opportunities. This ensures that strategies are crafted with a comprehensive understanding of the workforce.
- Empowerment and Ownership: By actively participating in shaping the employment equity strategies, employees feel a sense of ownership and commitment to achieving equity goals.
- Tailored Solutions: Employees have firsthand knowledge of workplace dynamics and potential barriers. Their feedback allows the CER to tailor initiatives and address specific workforce needs.
- Building Trust and Transparency: Consulting with employees demonstrates the CER's dedication to open communication and valuing their perspectives. This fosters a trusting and collaborative work environment.
- Improved Implementation: Employee feedback has been instrumental in refining strategies, policies, and practices. This, in turn, leads to more effective implementation and better outcomes for the self-identification campaign and other employment equity initiatives.
Looking Forward
The CER remains committed to ongoing consultations with employee groups. This collaborative approach ensures that employment equity initiatives are not only relevant and impactful but also reflect the diverse voices that make up the organization.
References
- Accessible Canada Act. Retrieved on July 27, 2024, from: Accessible Canada Act (justice.gc.ca).
- Accessibility Strategy for the Public Service of Canada. Retrieved on July 27, 2024, from: Accessibility Strategy for the Public Service of Canada – Canada.ca.
- Audit of Employment Equity Representation in Recruitment. Retrieved on July 27, 2024, from: Audit of Employment Equity Representation in Recruitment – Canada.ca.
- Call to Action on Anti-Racism, Equity, and Inclusion in the Federal Public Service. Retrieved on July 29, 2024, from: Call to Action on Anti-Racism, Equity, and Inclusion in the Federal Public Service – Privy Council Office – Canada.ca
- Canadian Charter of Rights and Freedoms. Retrieved on July 27, 2024, from: The Canadian Charter of Rights and Freedoms (justice.gc.ca).
- Canada Energy Regulator Strategic Plan. Retrieved on July 29, 2024, from: strategic plan (cer-rec.gc.ca).
- Canadian Human Rights Act. Retrieved on July 27, 2024, from: Canadian Human Rights Act (justice.gc.ca).
- CER Accessibility Plan and Annual Report 2023-24
- CER Diversity and Belonging Roadmap Progress Report 2023-24
- Employee self-identification form. Retrieved on July 27, 2024, from: Employee self-identification form – Canada.ca.
- Employment Equity Act. Retrieved on July 27, 2024, from: Employment Equity Act (justice.gc.ca).
- Federal Speakers' Forum on Diversity and Inclusion. Retrieved on July 27, 2024, from: Federal Speakers' Forum on Diversity and Inclusion: Overview – Canada.ca.
- Mosaic Leadership Development program. Retrieved on July 27, 2024, from: Mosaic Leadership Development program: Overview – Canada.ca.
- Public Service Employment Act. Retrieved on July 27, 2024, from: Public Service Employment Act (justice.gc.ca).
- Public Service Employment Act amendments. Retrieved on July 27, 2024, from: Taking Action to Address Potential Barriers in Staffing: Public Service Employment Act amendments receive Royal Assent – Canada.ca.
- Public Service Employee Survey (PSES) Results 2023
- Treasury Board of Canada Secretariat - Employment Equity Annual Report 2023
Annex A – Employment Equity Plan
Commitments, Measures and Targets for 2021-24
This three-year plan outlines the CER’s commitments, measures, and targets to meet employment equity goals and advance diversity and inclusion in the workplace – to correct historical disadvantages, support safe, accessible, and healthy work environments and lead to better program outcomes for those we serve. Monitoring and reporting will be done yearly, and the plan adjusted in consultation with equity-deserving employee groups to reflect progress and learnings.
Where possible, we indicated alignment with our response to the Call to Action on Anti-Racism, Equity, and Inclusion in the Federal Public Service, the 2020/2021 Deputy Minister Commitments on Diversity and Inclusion, as well as internally focused initiatives driven by the CER’s Strategic Plan, such as Diversity & Belonging Roadmap; Post-Pandemic Workplace Approach and Indigenous Recruitment, Retention, and Advancement Strategy.
Employment Equity Act legislative requirement |
Commitments |
Measures |
Targets |
Results (met or not met) |
Reasons of delay |
|---|---|---|---|---|---|
1. Collection of workforce data |
1.1 Ensure all new employees are provided the opportunity to complete and return self-identification form |
Analysis of completion rate on March 31 each year |
80% completion rate |
Not met |
Treasury Board of Canada Secretariat new self-ID form was not yet available. |
1.2 Encourage existing employees to complete modernized self-identification form in MyGCHRFootnote 2 |
Communications plan and activities Analysis of completion rate on March 31 of first year only |
100% activities completed. 80% completion rate |
Met |
- |
|
1.3 Send annual reminder to update profile and intent of data collection |
Annual corporate communication |
One communication per year |
Met |
- |
|
2. Workforce Analysis |
2.1 Analyze the representation of designated groups in CER workforce and by aggregated occupational group in annual employment equity report and by job family and classification level |
Analysis of employment equity data compiled as of March 31 of each year |
Representation of designated groups in CER workforce and by aggregated occupational group at least comparable to workforce availability ratesFootnote 3 |
Partially met |
Gaps remain per analysis presented in this report |
Intentional strategies established to address under-representation, in consultation with employee equity-deserving groupsFootnote 4 |
Met |
- |
|||
2.2 Analyze recruitment promotions and departure rates of designated group members in the annual employment equity report |
Analysis of employment equity data compiled as of March 31 each year |
Recruitment, promotion, and job retention rates for designated group members measuredFootnote 5 Intentional strategies established address under-representation where necessary with employee equitydeserving groupsFootnote 6 |
Met |
- |
|
2.3 Analyze projected gaps based on historical hiring, retirements and voluntary attrition and pending departmental hiring plans to ensure targets are based on the current data |
Forecast gaps using employment equity data as of March 31 each year; hiring, retirement, voluntary attrition data; previous three years and hiring data from each business unit |
Future gaps for designated group members measured Intentional strategies established address future underrepresentation |
Met |
Gaps remain per analysis presented in this report |
|
3. Employment systems review |
3.1 Assess the need for an employment systems review. |
Commitment and implementation from Senior Management |
If the employment systems review finds issues, intentional strategies established, and action plans updated yearly where necessary |
Met |
- |
3.2 Review and update people and workplace policies, programs and initiatives support employment equity, diversity, and inclusion and Reconciliation objectives |
People and workplace policies, programs and initiatives integrate positive practices supporting employment equity, diversity, inclusion and Reconciliation – including through Gender-based analysis plusFootnote 7 Equity-deserving groups have representation on internal management and advisory committees and their views are represented at executiveFootnote 8 |
Policies, programs, and initiatives reviewed, prioritized, and updated as part of cycle threeyear review process 100% of Internal Services Memorandum for CEO Decision capture EDI and GBA+ considerations, including on how the needs and views of equity-deserving employee groups have been addressed (e.g., new contracts, a revised HR policy) 100% of major employeefocused strategic initiatives consider views of equity-deserving groups (e.g., diversity and belonging, post pandemic workplace approach, culture definition and audit) |
All met |
- |
|
3.3 Review staffing guidance, tools, training, and practices to support employment equity, diversity, inclusion and Reconciliation objectives |
Positive practices supporting employment equity, diversity, inclusion and Reconciliation integrated to staffing guidance, tools, training, and practices |
75% of new Job descriptions and Statement of Merit Criteria reviewed for plain language |
All met |
- |
|
4.Employment Equity Positive practices |
4.1 Recruit members from designated groups for all levels and communicate opportunities through innovative means to increase visibility with equity-deserving employee groups |
Percentage of applicants (including students and trainees) from equity-deserving groups who applied for a position. Percentage of candidates (including students and trainees) from equity-deserving groups hired by the CER |
Representation comparable or exceeds workforce availability rates for applicants, candidates, and appointments |
Partially met |
Gaps remain per analysis presented in this report |
Percentage of appointments and promotion of Indigenous, Visible Minorities and People with disabilities to Management Position (NEB-11 to 16), including through career development and talent managementFootnote 9 |
Intentional recruitment strategies established and reviewed with equity-deserving employee groups |
Partially met |
|||
4.2 Review course offerings and leadership development opportunities that relate to employment equity, diversity, and inclusion |
Analysis of course offerings to determine whether the CER provides sufficient training on employment equity, diversity, and inclusion (e.g., unconscious biases, accommodation, antiracism, cultural competency) |
Yearly review of curriculum as part of the annual planning process Course attendance log |
Met |
- |
|
4.3 Support equity-deserving employee groups, initiatives, and eventsFootnote 10 |
Integration into performance management system Number of activities and events held during the fiscal year |
Formalized corporate citizenship accountability and time code. A minimum of 10 initiatives and events per fiscal year |
All met |
- |
|
4.4 Identify and support career development, leadership development and mentorship of employees belonging to equity-deserving groups |
Number of Indigenous, visible minorities and People with disabilities taking part in leadership development programs (for example, the Executive Leadership Development Program or the Building Black Leaders Initiative) and career development services (for example, official language training)Footnote 11 |
Year over year to meet or exceed targets in Annex B |
All met |
- |
|
4.5 Tailor mental health support to meet the needs of equitydeserving groups |
Employee Family and Assistance Program includes culturally sensitive services to meet the needs of equitydeserving groups |
In place before March 31, 2022 |
All met |
- |
|
Elder-in-residence program for Indigenous employees |
In place before August 31, 2021 |
||||
4.6 Demonstrate Management commitment to employment equity, diversity, and inclusionFootnote 12 |
Formalized leadership performance management accountabilities related to equity, diversity, and inclusion |
100% of leaders at the EVP, VP, Professional Leader, and Director levels have diversity and inclusion related accountabilities. |
Met |
- |
|
4.7 Combat racism, discrimination, and other barriers to inclusion in the workplace empowering employees to speak up about bias and oppression, and better equipping managers to address these issuesFootnote 13 |
Workshops, events and learning activities antiracism, discrimination and leading inclusively |
90% of staff take part in at least one activity |
All met |
- |
|
Process, tools, and training to supporting prevention and reporting of occurrences of harassment and discriminationFootnote 14 |
100% of staff and leaders Workplace Harassment and Violence Prevention mandatory training before December 31, 2021 |
||||
Culturally sensitive options to support reporting, conciliation, and investigationFootnote 15 |
In place before March 31, 2022 |
||||
Independent ombudsman reporting directly to the CEOFootnote 16 |
In place before March 31, 2022 |
||||
4.8 Attend Multiculturalism Champions Network meetings to share best practices and lessons learned |
Number of meetings attended compared with the number held. Best practices shared within the CER |
100% participation rate by Diversity and Inclusion Champion and/or designated official |
Met |
- |
|
4.9 Adapt our pandemic and post-pandemic physical and digital workspaces to be responsive to the needs of equity-deserving groups |
Review of facilities office equipment and digital tools to find improvements, including to support Accessible Canada Act implementationFootnote 17 Information available on intranet and leader training on accommodations and other topics related to the needs of a diverse remote/hybrid workforce |
Yearly review and strategies established to fill gaps where necessary |
Met |
- |
|
5. Monitoring of progress and review and revision of the plan |
5.1 Review the triennial employment equity, diversity, and inclusion plan |
Follow-up and documentation of the status of commitments |
Yearly review included as part of the annual employment equity report, and revision to plan as necessary |
Met |
- |
5.2 Review of PSES results by equity-deserving groups |
Trend analysis to find persisting inequities in workplace experience between equity-deserving groupsFootnote 18, including on Q21, 32, 40, 45 and 46 and those about harassment, discrimination, and anti-racism |
Yearly analysis performed. Year on year progress to reduce gaps between equity deserving groups and non-equity deserving groupsFootnote 19 |
All met |
- |
|
Opportunities to review and discuss PSES results with staff, leaders, Union, and equity-deserving groups |
100% of identified groups, leaders and program officials take part in PSES review and discussionFootnote 20 |
||||
6. Communication with employees |
6.1 Discuss and highlight employment equity, diversity and inclusion including important topics such as accessibility and accommodation, within the CER through corporate and senior management communicationsFootnote 21 |
Reference to CER employment equity, diversity, and inclusion, including annual report, commitments, and targets |
2 communications per year on employment equity plan results |
All met |
- |
Communication to employees about activities and events organized by employee-driven groups |
100% of activities and events communicated to employees |
||||
7. Consultation and collaboration with employee representatives |
7.1 Consult with the Union Management Consultation Committee (UMCC) and other employee groups on the development and updates to the employment equity, diversity and inclusion plan and any subsequent reportingFootnote 22 |
Agenda item at UMCC meetings when appropriate Agenda Item and email correspondence with employee groups |
The UMCC consulted on the development and updates to the employment equity plan every three years, any subsequent reporting The UMCC consulted on the development and updates to the employment equity plan every 3 years, any subsequent reporting |
All met |
- |
8. Record maintenance |
8.1 Maintain confidential records to ensure they are kept following the Employment Equity Act 8.2 Support for robust reporting with central agencies |
Restricted access to employment equity data in information system Annual reports on implementation of Employment Equity Act, Multiculturalism Act, Accessible Canada Act, Departmental Results Report |
100% of requests to provide access to employment equity data in the system approved by Director, Integrated Planning and Reporting 100% of reports are supported with strong lines of evidence to show compliance and organizational efforts |
All met |
- |
Annex B – Employment Equity Numerical Goals for 2024-25
TABLE 2A – WOMEN |
GAP |
3 Year Recruitment Goals 2024–26 |
||
|---|---|---|---|---|
Occupational Group Gap and Position(s) |
2024 |
2025 |
2026 |
|
Semi-Professionals and Technician
|
1 |
- |
- |
- |
Administrative and Senior Clerical Personnel
|
1 |
- |
- |
- |
Intermediate Sales and Service Personnel
|
1 |
- |
- |
- |
TABLE 2B – Indigenous People |
GAP |
3 Year Recruitment Goals 2024–26 |
||
|---|---|---|---|---|
Occupational Group Gap and Position(s) |
2024 |
2025 |
2026 |
|
| Senior Managers | 1 | - | 1 | - |
Clerical Personnel
|
3 | - | 2 | 1 |
TABLE 2C – VISIBLE MINORITIES |
GAP |
3 Year Recruitment Goals 2024–26 |
||
|---|---|---|---|---|
Occupational Group Gap and Position(s) |
2024 |
2025 |
2026 |
|
Middle and Other Managers
|
1 |
- |
- |
- |
Professionals
|
26 |
- |
1 |
2 |
Semi-Professionals and Technicians
|
5 |
- |
- |
- |
Supervisors
|
1 |
1 |
- |
- |
Administrative and Senior Clerical Personnel
|
1 |
- |
- |
- |
TABLE 2D – PERSONS WITH DISABILITIES |
GAP |
3 Year Recruitment Goals 2024–26 |
||
|---|---|---|---|---|
Occupational Group Gap and Position(s) |
2024 |
2025 |
2026 |
|
Professionals |
7 |
1 |
2 |
3 |
Supervisors |
1 |
- |
- |
- |
Administrative and Senior Clerical Personnel |
1 |
- |
- |
- |
Clerical Personnel |
2 |
- |
- |
- |
Note: Due to the small number of employees in certain occupational groups at the Canada Energy Regulator (CER), specifically those with 3-4 positions, it is challenging to fill these roles due to limited turnover. As a result, immediate action to address any occupational gaps identified in these areas may be constrained.
Note: Current Employment Equity gaps identified in the WEIMS system are based on 2016 census data. Gaps are subject to change when the database is updated with the 2021 census data, hopefully in during the 2024-2025 fiscal year
- Date modified: