Canada Energy Regulator – 2021–22 Departmental Results Report – Spending and human resources
Spending
Spending 2019–20 to 2024–25
The following graph presents planned (voted and statutory spending) over time.
Graphic description
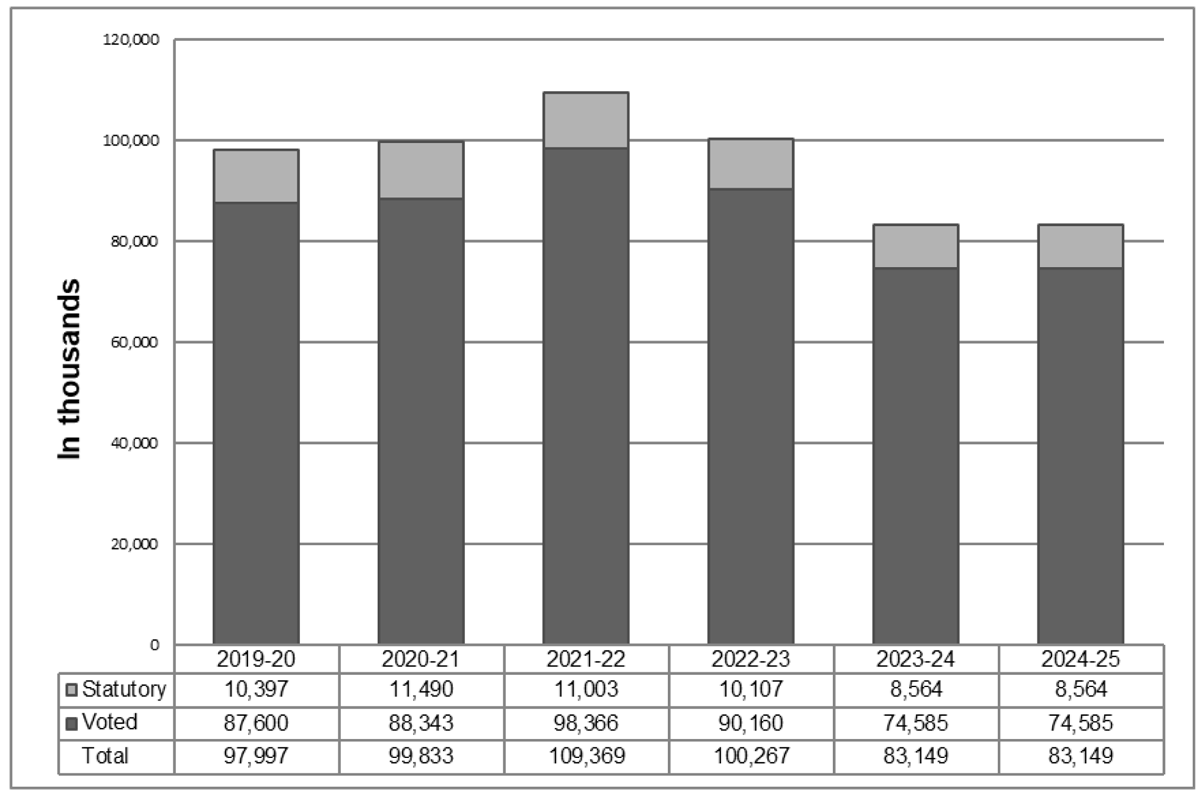
Departmental Spending 2019–20 to 2024–25 (in thousands of dollars)
This bar chart shows the Canada Energy Regulator’s six-year (voted and statutory) spending trend.
2019–20 Statutory: 10,397
2019–20 Voted: 87,600
2019–20 Total: 97,997
2020–21 Statutory: 11,490
2020–21 Voted: 88,343
2020–21 Total: 99,833
2021–22 Statutory: 11,003
2021–22 Voted: 98,366
2021–22 Total: 109,369
2022–23 Statutory: 10,107
2022–23 Voted: 90,160
2022–23 Total: 100,267
2023–24 Statutory: 8,564
2023–24 Voted: 74,585
2023–24 Total: 83,149
2024–25 Statutory: 8,564
2024–25 Voted: 74,585
2024–25 Total: 83,149
The CER is funded through Parliamentary appropriations. The Government of Canada currently recovers a large majority of the appropriation from the industry the CER regulates. All collections from cost recovery invoices are deposited to the account of the Receiver General for Canada and credited to the Consolidated Revenue Fund.
Pipeline and power line companies that hold authorizations under the Canadian Energy Regulator Act are subject to cost recovery. Applications before the CER for new facilities are not subject to cost recovery until the facility is placed into service, unless the company does not have any prior facilities regulated by the CER in which case a one-time levy is assessed following the authorization of construction.
Cost recovery is carried out on a calendar year basis.
Budgetary performance summary for core responsibilities and internal services (dollars)
The “Budgetary performance summary for core responsibilities and internal services” table presents the budgetary financial resources allocated for the CER’s core responsibilities and for internal services.
Core responsibilities and internal services |
2021–22 |
2021–22 |
2022–23 |
2023–24 |
2021–22 |
2019–20 |
2020–21 |
2021–22 |
|---|---|---|---|---|---|---|---|---|
Energy Adjudication |
19,419,562 |
19,419,562 |
18,753,370 |
15,667,637 |
20,258,800 |
21,550,144 |
20,864,381 |
17,722,847 |
Safety and Environment Oversight |
25,473,425 |
25,473,425 |
23,618,055 |
21,460,856 |
25,770,209 |
24,588,408 |
23,152,134 |
24,544,585 |
Energy Information |
8,112,706 |
8,112,706 |
6,919,278 |
5,174,538 |
8,208,531 |
9,235,424 |
5,934,378 |
8,716,482 |
Engagement |
10,789,048 |
10,789,048 |
9,262,659 |
5,635,459 |
11,089,417 |
7,611,046 |
9,611,208 |
8,732,565 |
Subtotal |
63,794,741 |
63,794,741 |
58,553,362 |
47,938,490 |
65,326,957 |
62,985,022 |
59,562,101 |
59,716,479 |
Internal services |
44,298,450 |
44,298,450 |
41,713,697 |
35,210,475 |
46,958,602 |
35,011,968 |
39,028,902 |
49,652,874 |
Internal Services |
|
|
|
|
|
|
1,241,925 |
|
Total |
108,093,191 |
108,093,191 |
100,267,059 |
83,148,965 |
112,285,559 |
97,996,990 |
99,832,928 |
109,369,353 |
Variance between 2019–20 Actual spending and 2020–21 Actual spending
The 2020–21 actual spending is $1.84 million higher than the 2019–20 actual spending primarily due to:
- a decrease of $2.33 million related to Transportation as a result of restriction of COVID-19;
- increase of $1.24 million related to remission to Vector Pipeline Limited Partnership;
- an increase of $1.0 million mainly related to SAP implementation project; and
- a net increase of $1.93 million related to information and technology hardware updates.
Variance between 2020–21 Actual spending and 2021–22 Actual spending
The 2021–22 actual spending is $9.54 million higher than the 2020–21 actual spending, and the variance is primarily due to:
- an increase of $0.07 million related to Budget 2017 Indigenous Advisory and Monitoring Committees as well as communications and access to information capacity;
- an increase of $2.98 million mainly related to a Budget 2020 initiative to improve the CER’s ability to interpret and make data available digitally to Canadians;
- an increase of $2.10 million related to a Budget 2018 initiative to transition to new impact assessment and regulatory processes;
- an increase of $0.76 million related to 2021–22 employee benefit plan costs;
- an increase of $4.85 million related to other compensation adjustments including changes to terms and conditions of service or employment in the federal public administration;
- an increase of $0.29 million mainly related to the SAP implementation project; and
- a decrease of $1.24 million mainly related to the remission of a levy to Vector Pipeline Limited Partnership in fiscal year 2020–21.
Variance between 2021–22 Planned spending and 2021–22 Actual spending
The 2021–22 actual spending is $1.28 million higher than the 2021–22 planned spending, and the variance is primarily due to:
- a decrease of $0.56 million related to Budget 2017 Indigenous Advisory and Monitoring Committees as well as communications and access to information capacity;
- a decrease of $1.22 million mainly related to a Budget 2020 initiative to improve the CER’s ability to interpret and make data available digitally to Canadians;
- a decrease of $1.60 million related to a Budget 2018 initiative to transition to new impact assessment and regulatory processes;
- an increase of $0.23 million related to 2021–22 employee benefit plan costs; and
- an increase of $4.43 million related to other compensation adjustments including changes to terms and conditions of service or employment in the federal public administration.
Variance between 2021–22 Total authorities available for use and 2021–22 Actual spending
The 2021–22 actual spending is $2.92 million lower than the 2021–22 total authorities, and the variance is primarily due to:
- a decrease of $0.56 million related to Budget 2017 Indigenous Advisory and Monitoring Committees as well as communications and access to information capacity;
- a decrease of $1.42 million mainly related to a Budget 2020 initiative to improve the CER’s ability to interpret and make data available digitally to Canadians;
- a decrease of $1.60 million related to a Budget 2018 initiative to transition to new impact assessment and regulatory processes; and
- an increase of $0.66 million related to other compensation adjustments including changes to terms and conditions of service or employment in the federal public administration.
Variance between 2021–22 Total authorities available for use and 2021–22 Planned spending
The 2021–22 total authorities available for use is $4.19 million higher than the 2021–22 Planned spending primarily due to:
- an increase of $2.89 million related to operating budget carry forward from 2020–21 to 2021–22;
- an increase of $0.20 million related to funding to improve the quality and accessibility to public data;
- an increase of $0.23 million related to employee benefit plan; and
- an increase of $0.87 million mainly related to other compensation adjustments including changes to terms and conditions of service or employment of the federal public administration.
Variance between 2022–23 Planned spending and 2021–22 Planned spending
The 2022–23 planned spending is $7.83 million lower than the 2021–22 planned spending primarily due to:
- a decrease of $1.76 million related to Budget 2017 Indigenous Advisory and Monitoring Committees;
- a decrease of $1.04 million related to a Budget 2018 initiative to transition to new impact assessment and regulatory processes;
- a decrease of $3.01 million related to a Budget 2020 initiative to improve the CER’s ability to interpret and make data available digitally to Canadians; and
- a net decrease of $2.02 million related to other compensation adjustments including changes to terms and conditions of service or employment in the federal public administration.
Variance between 2022–23 Planned spending and 2023–24 Planned spending
The 2023–24 planned spending is $17.12 million lower than the 2022–23 planned spending mainly due to:
- a decrease of $8.92 million related to Budget 2018 transition to new impact assessment and regulatory processes funding;
- a decrease of $3.72 million related to funding to improve the CER’s ability to interpret and make data available digitally to Canadians;
- a decrease of $2.94 million related to other compensation adjustments including changes to terms and conditions of service or employment of the federal public administration; and
- a decrease of $1.54 million mainly related to employee benefit plan.
Human resources
The “Human resources summary for core responsibilities and internal services” table presents the full-time equivalents (FTEs) allocated to each of the CER’s core responsibilities and to internal services.
Human resources summary for core responsibilities and internal services
Core responsibilities and internal services |
2019–20 |
2020–21 |
2021–22 |
2021–22 |
2022–23 |
2023–24 |
|---|---|---|---|---|---|---|
Energy Adjudication |
119.2 |
129.4 |
107.0 |
104.1 |
101.5 |
88.5 |
Safety and Environment Oversight |
131.0 |
142.5 |
144.5 |
150.7 |
132.5 |
122.0 |
Energy Information |
43.8 |
30.4 |
54.4 |
48.2 |
33.1 |
30.1 |
Engagement |
37.8 |
56.9 |
47.6 |
51.4 |
46.1 |
28.1 |
Subtotal |
331.8 |
359.2 |
353.5 |
354.4 |
313.2 |
268.7 |
Internal services |
162.2 |
162.4 |
191.5 |
204.3 |
176.8 |
162.3 |
Total |
494.0 |
521.6 |
545.0 |
558.7 |
490.0 |
431.0 |
Variance between 2019–20 Actual full-time equivalents and 2020–21 Actual full-time equivalents
The increase of 27.6 FTEs from 2019–20 actual to the 2020–21 actual is mainly to stabilize the CER’s operations and improve its ability to interpret and make data available digitally to Canadians.
Variance between 2020–21 Actual full-time equivalents and 2021–22 Actual full-time equivalents
The increase of 37.1 full-time equivalents from 2020–21 actual full-time equivalents to 2021–22 actual full-time equivalents is primarily due to:
- a decrease of 1.1 full-time equivalents related to Budget 2017 Indigenous Advisory and Monitoring Committees;
- an increase of 4.3 full-time equivalents related to a Budget 2018 initiative to transition to new impact assessment and regulatory processes;
- an increase of 14.9 full-time equivalents related to a Budget 2020 initiative to improve the CER’s ability to interpret and make data available digitally to Canadians; and
- an increase of 19.0 full-time equivalents related to changes across the organization to meet operational requirements.
Variance between 2021–22 Actual full-time equivalents and 2021–22 Planned full-time equivalents
The increase of 13.7 full-time equivalents from 2021–22 planned full-time equivalents to 2021–22 actual full-time equivalents is primarily due to:
- a decrease of 4.6 full-time equivalents related to Budget 2017 Indigenous Advisory and Monitoring Committees;
- a decrease of 5.7 full-time equivalents related to a Budget 2018 initiative to transition to new impact assessment and regulatory processes;
- a decrease of 1.1 full-time equivalents related to a Budget 2020 initiative to improve the CER’s ability to interpret and make data available digitally to Canadians; and
- an increase of 25.1 full-time equivalents related to changes across the organization to meet operational requirements.
Variance between 2021–22 Planned full-time equivalents and 2022–23 Planned full-time equivalents
The decrease of 55.0 full-time equivalents from 2021–22 planned full-time equivalents to 2022–23 planned full-time equivalents is primarily due to:
- a decrease of 10.0 full-time equivalents related to Budget 2017 Indigenous Advisory and Monitoring Committees;
- a decrease of 6.0 full-time equivalents related to a Budget 2018 initiative to transition to new impact assessment and regulatory processes;
- a decrease of 30.0 full-time equivalents related to a Budget 2020 initiative to improve the CER’s ability to interpret and make data available digitally to Canadians; and
- a decrease of 9.0 full-time equivalents related to changes across the organization to meet operational requirements.
Variance between 2022–23 Planned full-time equivalents and 2023–24 Planned full-time equivalents
The decrease of 59.0 full-time equivalents from 2022–23 planned full-time to 2023–24 planned full-time equivalents is mainly attributed to the following:
- a decrease of 43.0 full-time equivalents related to Budget 2018 transition to new impact assessment and regulatory processes; and
- a decrease of 16.0 full-time equivalents related to changes in funding levels.
Expenditures by vote
For information on the CER’s organizational voted and statutory expenditures, consult the Public Accounts of Canada 2021.Footnote 63
Government of Canada spending and activities
Information on the alignment of the CER’s spending with Government of Canada’s spending and activities is available in GC InfoBase.Footnote 64
Financial statements and financial statements highlights
Financial statements
The CER’s financial statements (unaudited) for the year ended March 31, 2022, are available on the departmental websiteFootnote 65.
Financial statement highlights
Condensed Statement of Operations (unaudited) for the year ended March 31, 2022 (dollars)
Financial information |
2021–22 |
2021–22 |
2020–21 |
Difference |
Difference |
|---|---|---|---|---|---|
Total expenses |
125,487,553 |
124,582,894 |
115,678,025 |
(904,659) |
8,904,869 |
Total revenues |
– |
– |
– |
– |
– |
Net cost of operations before government funding and transfers |
125,487,553 |
124,582,894 |
115,678,025 |
(904,659) |
8,904,869 |
The actual net cost of operations before government funding and transfers in 2021–22 was $0.90 million lower than the planned results for the same fiscal year. The net decrease is primarily due to:
- a decrease of $0.56 million related to Budget 2017 Indigenous Advisory and Monitoring Committees as well as communications and access to information capacity;
- a decrease of $1.60 million mainly related to a Budget 2020 initiative to improve the CER’s ability to interpret and make data available digitally to Canadians;
- a decrease of $1.22 million related to a Budget 2018 initiative to transition to new impact assessment and regulatory processes;
- an increase of $0.23 million related to 2021–22 employee benefit plan costs; and
- a net increase of $4.05 million related to other compensation adjustments including changes to terms and conditions of service or employment in the federal public administration.
The actual net cost of operations before government funding and transfers in 2021–22 was $8.90 million higher than the actual results for the previous fiscal year. The net increase is primarily due to:
- an increase of $0.07 million related to Budget 2017 Indigenous Advisory and Monitoring Committees as well as communications and access to information capacity;
- an increase of $2.98 million mainly related to a Budget 2020 initiative to improve the CER’s ability to interpret and make data available digitally to Canadians;
- an increase of $2.10 million related to a Budget 2018 initiative to transition to new impact assessment and regulatory processes;
- an increase of $0.76 million related to 2021–22 employee benefit plan costs;
- an increase of $0.29 million mainly related to an SAP implementation project; and
- a net increase of $2.70 million related to other compensation adjustments including changes to terms and conditions of service or employment in the federal public administration.
Condensed Statement of Financial Position (unaudited) as of March 31, 2022 (dollars)
Financial information |
2021–22 |
2020–21 |
Difference |
|---|---|---|---|
Total net liabilities |
23,164,975 |
30,801,754 |
(7,636,779) |
Total net financial assets |
10,738,896 |
17,666,410 |
(6,927,514) |
Departmental net debt |
12,426,079 |
13,135,344 |
(709,265) |
Total non-financial assets |
13,078,019 |
14,020,372 |
(942,353) |
Departmental net financial position |
651,940 |
885,028 |
(233,088) |
The decrease in net financial assets is mainly caused by a planned settlement of accounts payable to reduce payables near year-end to support the transition to SAP after year-end. The decrease in net debt is primarily due to the amortization of tangible capital assets net of acquisitions of tangible capital assets.
The 2021–22 planned results information is provided in the CER’s Future-Oriented Statement of Operations and Notes 2021–22Footnote 66.
- Date modified: