ARCHIVED – Canadian Energy Overview 2012 - Energy Briefing Note
This page has been archived on the Web
Information identified as archived is provided for reference, research or recordkeeping purposes. It is not subject to the Government of Canada Web Standards and has not been altered or updated since it was archived. Please contact us to request a format other than those available.
Canadian Energy Overview 2012 - Energy Briefing Note [PDF 634 KB]
July 2013
Copyright/Permission to Reproduce
ISSN 1917-506X
Table of Contents
Energy and the Canadian Economy
Crude Oil and Petroleum Products
Appendix 1 - Canadian Oil Reserves at 31 December 2011
Appendix 2 - Estimates of Canadian Natural Gas Reserves at 31 December 2011
Foreword
The National Energy Board (NEB or Board) is an independent federal regulator whose purpose is to promote safety and security, environmental protection and efficient infrastructure and markets in the Canadian public interest[1] within the mandate set by Parliament for the regulation of pipelines, energy development, and trade.
The Board's main responsibilities include regulating the construction and operation of interprovincial and international oil and natural gas pipelines, international power lines, and designated interprovincial power lines. Furthermore, the Board regulates the tolls and tariffs for the pipelines under its jurisdiction. With respect to the specific energy commodities, the Board regulates the export of natural gas, oil, natural gas liquids (NGLs) and electricity, and the import of natural gas. Additionally, the Board regulates oil and natural gas exploration and development on frontier lands and offshore areas not covered by provincial or federal management agreements.
For oil and natural gas exports, the Board’s role is to evaluate whether the oil and natural gas proposed to be exported is surplus to reasonably foreseeable Canadian requirements, having regard to the trends in the discovery of oil or gas in Canada.[2] The Board monitors energy markets, and provides its view of Canadian energy requirements and trends in discovery of oil and natural gas to support its responsibilities under Part VI of the National Energy Board Act (the NEB Act). The Board periodically publishes assessments of Canadian energy supply, demand and markets in support of its ongoing market monitoring. These assessments address various aspects of energy markets in Canada. This Energy Briefing Note (EBN), the Canadian Energy Overview, is one such assessment. Canadian Energy Overview 2012 reviews the year’s energy markets and is an abridged form of previous editions.
If a party wishes to rely on material from this report in any regulatory proceeding before the NEB, it may submit the material, just as it may submit any public document. Under these circumstances, the submitting party in effect adopts the material and that party could be required to answer questions pertaining to the material.
This report does not provide an indication about whether any application will be approved or not. The Board will decide on specific applications based on the material in evidence before it at that time.
Overview
- The Canadian oil and gas industry experienced an increasingly challenging year in 2012, while consumers benefited from stable prices and ample supplies. The oil industry faced limited access to markets, and the natural gas industry felt the effects of strong U.S. gas production.
- Energy production increased in 2012 and growth in energy consumption slowed. Domestic energy production increased by about 2 per cent, with growth in petroleum offset by a decline in natural gas production. Domestic energy consumption grew slightly in all categories, and overall by 1.1 per cent in 2012 compared with 2.5 per cent in 2011.
- In 2012, oil prices in western Canada were discounted, relative to world prices and also relative to West Texas Intermediate (WTI)[3], as a result of rapidly rising oil production on the North American midcontinent, combined with crude oil transportation bottlenecks that limited access to traditional markets. These developments are estimated to have reduced annualized Gross Domestic Product (GDP) growth by 0.4 percentage points in the second half of 2012.[4] Canadian GDP increased by 1.8 per cent in 2012 after growing by 2.6 per cent in 2011.
- In response to crude oil transportation bottlenecks, many companies opted to move crude oil by rail. By December 2012, crude-by-rail in Canada expanded to an estimated 19,072 m³/d (120,000 bbl/d).
- After a very active 2011, the leasing of petroleum rights in Western Canada fell to $1.32 billion[5], the lowest level since 2002. Industry did not identify any large prospects with available rights. In particular, Alberta’s revenue from the sale of petroleum rights fell from a record $3.59 billion in 2011 to $1.12 billion in 2012.
- Continuing the long-term trend, gas well drilling fell yet again. Gas prices were not high enough for companies to cover costs except for a few gas plays in Western Canada. In turn, Canadian marketable natural gas production fell to 392.7 106m³/d (13.9 Bcf/d).
- In 2012, natural gas prices in Alberta averaged $2.30/GJ. Prices at Henry Hub[6] averaged US$2.80/MMBtu and reached their lowest point in April 2012, at US$1.82/MMBtu. The last time prices were at that level was in the winter of 1999. In November 2012, combined U.S. and Canada natural gas storage reached record high inventory levels of 131 109m³ (4.64 Tcf).
- In November 2012, the direction of flow at the Niagara export point was reversed, importing 10.2 106m³/d (360 MMcf/d) on average of natural gas from the U.S. In contrast, in the early 2000s almost 22.7 106m³/d (800 MMcf/d) of natural gas was being exported to the U.S. at Niagara.
- Electricity trade was at record levels in 2012. Exports increased to a 10-year high and imports fell to a 10-year low, driven by strong electricity sales in B.C., Ontario and Quebec. Electricity prices in North American markets were relatively low in 2012 due to limited economic growth and low natural gas costs. Net revenues for 2012 were only slightly higher than in 2011.
Energy and the Canadian Economy
- The energy industry’s contribution of 9.5 per cent to Canada’s GDP in 2012 was very similar to its contribution of 9.6 per cent in 2011 (Table 1). Revenue from Canadian energy exports was slightly higher in 2012 than in 2011 at $107.6 billion.
- In 2012, the WTI crude oil price averaged approximately US$94/bbl. However, the WTI price was on average US$18 lower than the leading global price benchmark, Brent. Edmonton Par (a light crude oil similar in quality to WTI) averaged approximately $86/bbl, about $8/bbl below WTI.
- Net energy export revenues were $73 billion in 2008 and $43 billion in 2009. Since 2009, net energy export revenues have been increasing and were about $63 billion in 2012. Also, net revenues have increasingly been derived from sales of crude oil and bitumen rather than from natural gas.
Table 1 - Key Canadian Energy and Economy Statistics
| 2011 | 2012 | % Change | |
|---|---|---|---|
| The energy industry’s direct contribution to GDP (per cent) | 9.6 | 9.5 | -1.0 |
| Annual energy export revenues (billion $) | 105.1 | 107.6 | 2.5 |
| The energy industry’s contribution to Canadian export revenues (per cent)[7] | 23.5 | 23.7 | 0.9 |
| Average WTI Crude Oil Prices (US$/bbl) | 94.88 | 94.00 | -0.9 |
Sources: Statistics Canada, 379-0031 and 228-0059, U.S. Energy Information Administration
Figure 1 - Net Energy Export Revenues
(109$)
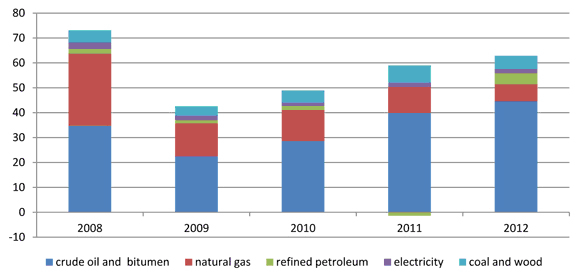
Source: Statistics Canada, 228-0059
- Overall domestic energy production increased by about 2 per cent in 2012 (Table 2). Growth in petroleum production and a decline in natural gas production occurred. Domestic secondary energy consumption grew slightly in all categories (Table 3).
Table 2 - Domestic Energy Production by Energy Source (petajoules)
| 2008 | 2009 | 2010 | 2011 | 2012[a] | % Change (2011-2012) |
|
|---|---|---|---|---|---|---|
| Petroleum[b] | 6 839 | 6 785 | 7 090 | 7 524 | 8 021 | 6.6 |
| Natural gas[c] | 6 385 | 5 984 | 5 772 | 5 765 | 5 500 | -4.6 |
| Hydroelectricity | 1 346 | 1 314 | 1 253 | 1 340 | 1 416 | 5.7 |
| Nuclear Electricity | 326 | 306 | 308 | 318 | 328 | 3.1 |
| Coal | 1 512 | 1 378 | 1 528 | 1 524 | 1 521 | -0.2 |
| Wind, Tidal and Solar Electricity | 14 | 24 | 35 | 37 | 43 | 15.7 |
| Other[d] | 584 | 560 | 552 | 544 | 527 | -3.1 |
| Total | 16 997 | 16 326 | 16 505 | 17 052 | 17 356 | 1.8 |
| Annual % Change | -3.9 | 1.1 | 3.3 | 1.8 |
[a] Estimates
[b] Petroleum includes crude oil and gas plant NGLs, upgraded and non-upgraded bitumen and condensate
[c] Marketable natural gas
[d] Includes solid wood waste, spent pulping liquor, wood and other fuels for electricity generation
Sources: NEB, Statistics Canada, Natural Resources Canada
Table 3 - Domestic Secondary Energy[8] Consumption (petajoules)
| 2008 | 2009 | 2010 | 2011 | 2012[a] | % Change (2011-2012) |
|
|---|---|---|---|---|---|---|
| Residential[b] | 1 505 | 1 429 | 1 361 | 1 451 | 1 475 | 1.7 |
| Commercial | 1 439 | 1 352 | 1 338 | 1 382 | 1 408 | 1.9 |
| Industrial[b][c] | 5 119 | 4 876 | 5 056 | 5 132 | 5 159 | 0.5 |
| Transportation | 2 547 | 2 511 | 2 592 | 2 642 | 2 686 | 1.7 |
| Total | 10 610 | 10 168 | 10 347 | 10 607 | 10 728 | 1.1 |
| Annual % Change | -4.2 | 1.8 | 2.5 | 1.1 |
[a] Estimates
[b] Includes biomass (wood and pulping liquor)
[c] Includes producer consumption energy use and non-energy use
Sources: NEB, Statistics Canada
Crude Oil and Petroleum Products
- The total number of western Canadian oil, gas, and service wells drilled in 2012 fell from 2011 levels, mostly because of a drop in the number of gas wells drilled, but also because of a small decrease in the number of oil wells drilled (Figure 2).
Figure 2 - Number of Wells Drilled - Western Canada
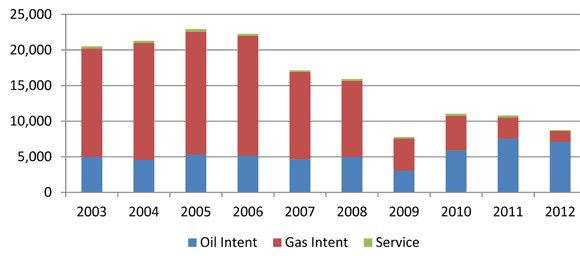
Source: NEB analysis of Divestco Inc. data
- Most of the reduction in gas drilling was because gas prices were lower than the cost of adding new production for almost all gas plays in Western Canada. Companies significantly reduced their investments and the drilling of new gas wells.
- In Western Canada, provincial government revenue from the leasing of petroleum rights fell to the lowest level since 2002 (Figure 3). In particular, Alberta’s revenue fell from a record $3.59 billion in 2011 to $1.12 billion in 2012. Industry did not identify any new, large oil or gas prospects with available rights, which reduced the posting of land and bidding.
Figure 3(a) - Western Canada Sedimentary Basin (WCSB) Oil, Natural Gas and Oil Sands Rights Expenditures - Bonuses ($ billion)
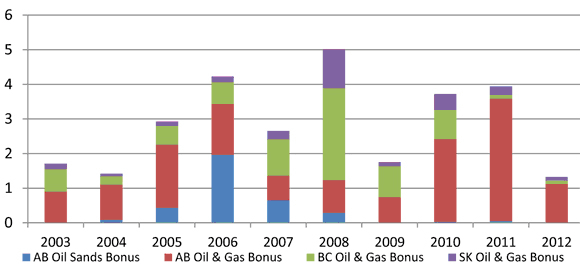
Source: Provincial governments
Figure 3(b) - WCSB Oil, Natural Gas and Oil Sands Land Activity
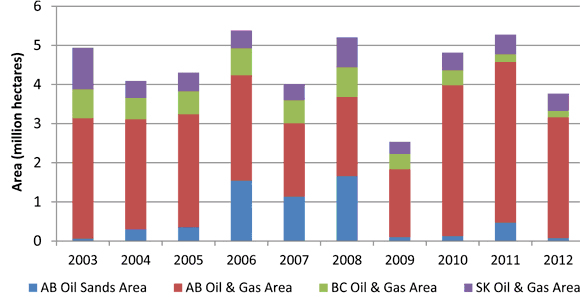
Source: Provincial governments
- In 2011, the Government of Nova Scotia released its Play Fairway Analysis[9] which re-evaluated the oil and gas potential of the province’s offshore areas. In response, companies committed to spend $2.05 billion on long-term oil and gas exploration to earn the petroleum rights in twelve offshore parcels in 2012.
- Other commitments to spending included $117 million to earn the rights to six parcels in offshore Newfoundland and Labrador. In Northern Canada, companies committed to spend $100 million to earn the rights to six parcels in the Beaufort Sea and two parcels in the Central Mackenzie Valley.
Figure 4 - Crude Oil and Equivalent Production by Province, 2012
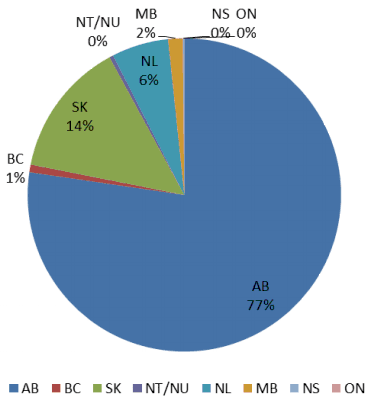
Sources: Governments of energy producing provinces, NEB
- Canadian crude oil production in 2012 increased by about seven per cent compared to 2011, averaging an estimated 513 960 m³/d (3.23 MMb/d). The growth was largely attributable to increased in situ oil sands production and tight oil production. In 2012, estimated synthetic crude oil increased by one per cent and non-upgraded bitumen production increased by 15 per cent over 2011 levels (Figure 5).
Figure 5 - Crude Oil and Equivalent Production by Type, 2012
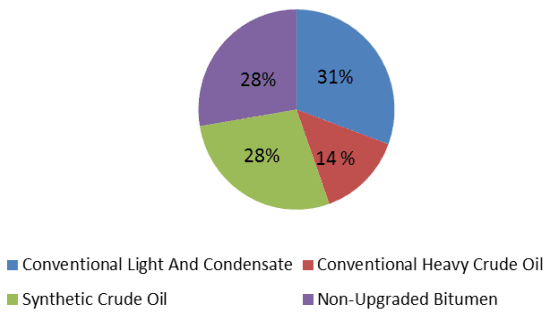
Sources: Governments of energy producing provinces, NEB
- Conventional light and conventional heavy oil production in the WCSB increased. Oil prices remained high enough to support oil drilling while low natural gas prices caused companies to further shift investment from gas to oil drilling. The estimated production of light crude oil in Western Canada increased by 15 per cent, largely because of gains in tight oil production. Heavy crude oil production gained by six per cent in 2012, compared with 2011. Oil production in Newfoundland and Labrador declined by 25 per cent in 2012, to 31 398 m³/d (197 556 bbl/d), reflecting extended downtime to perform facility maintenance at the Terra Nova and White Rose fields. Refer to Appendix 1 for estimates of Canadian Crude Oil and Bitumen Reserves.
Figure 6 - Crude Bitumen Production (10³m³/d and 106bbl/d)
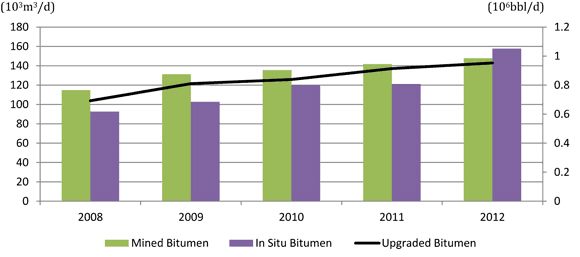
Source: Energy Resources Conservation Board (ERCB)
- Western Canadian oil prices dropped sharply in the second half of 2012. Rapidly increasing tight oil production in the U.S. and oil sands production in Canada created a glut of oil in the mid-continent. The differential widened between WTI and Brent (Figure 7). This deviated from the typical situation in which WTI-Brent and WTI-Edmonton Par or Western Canada Select[10] (WCS) differentials are mainly a consequence of differences in crude oil quality and transportation costs. For example, in December 2012, the differential between WTI and Edmonton Par widened to 15 per cent compared with an historical norm of zero difference, while the differential between WTI and WCS widened to about 34 per cent compared with an historical norm of about 20 per cent.
Figure 7 - WTI and North Sea Brent Oil Prices (US$/bbl)
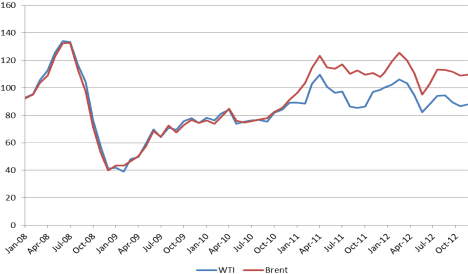
Source: U.S. Energy Information Administration
- The Bank of Canada estimated that annualized real GDP growth was reduced by 0.4 per cent as a result of the oil price differentials, temporary disruptions in transportation and production facilities, deterioration in Canada’s terms of trade as well as lower investment, exports and production[11].
- WTI oil prices were volatile in 2012, varying between a high of US$106/bbl and a low of US$82/bbl. Political instability in the Middle East contributed to higher prices while concerns about the global economic recovery put downward pressure on prices.
Figure 8 - Light and Heavy Crude Oil Export Prices
($/m³)
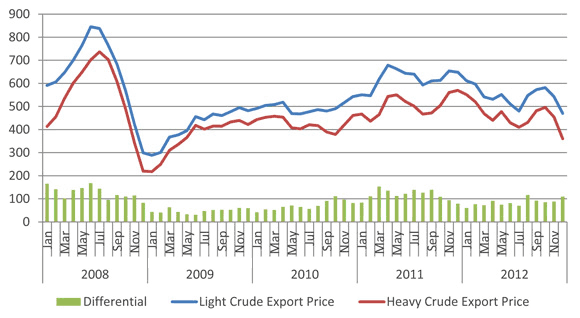
Source: NEB
Figure 9 - Average Annual Crude Oil Exports and Imports
(10³m³/d) and
(106bbl/d)
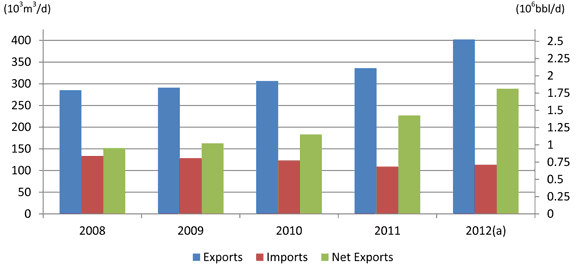
(a) Estimates
Sources: NEB, Statistics Canada
- In 2012, net crude oil exports averaged approximately 289 000 m³/d (1.82 million bbl/d), an increase of 27.1 per cent from 2011.
Table 4 - World Oil and Canadian Product Prices
| Product | 2011 | 2012 | Change | % Change |
|---|---|---|---|---|
| Gasoline (cents/litre) | 124.0 | 127.5 | 3.5 | 3 |
| Diesel (cents/litre) | 124.7 | 125.4 | 0.7 | 0.6 |
| Furnace oil (cents/litre) | 113.0 | 117.7 | 4.7 | 4 |
| WTI (US$/bbl, Cushing, OK) | 94.9 | 94.0 | -0.9 | -1 |
| Edmonton Par (Cdn$/bbl) | 95.6 | 86.0 | -9.6 | -10 |
Sources: Natural Resources Canada, Energy Information Administration, NEB
Natural Gas
- In Alberta, natural gas prices averaged $2.30/GJ in 2012. Natural gas prices at Henry Hub averaged US$2.80/MMBtu in 2012, 31 per cent below 2011 (US$4.04/MMBtu). Natural gas prices ranged between US$2.04/MMBtu and US$3.70/MMBtu (Figure 10) throughout the year. In 2012, gas prices were influenced by the increased availability of gas from unconventional sources, notably shale gas and natural gas produced as a byproduct of tight oil and shale oil production, as well as record high storage inventories. Moderate price volatility was observed in response to seasonal weather variability and increased demand for natural gas for power generation.
Figure 10 - North American Natural Gas Prices – Henry Hub (3-day average price) (US$/MMBtu)
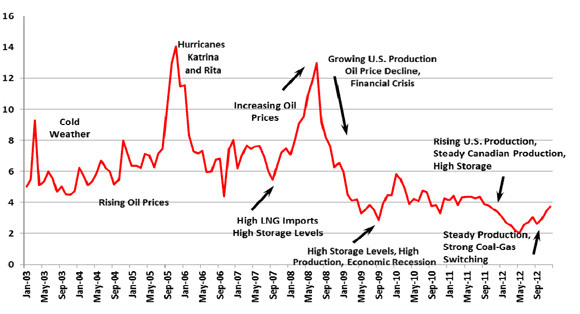
Source: GLJ Publications Inc.
Figure 11 - Canada and U.S. Storage Inventories (Tcf)
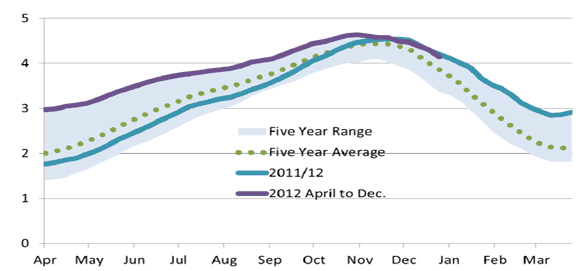
Sources: U.S. Energy Information Administration, Enerdata
- In 2012, Canadian natural gas consumption was estimated at 240 106m³/d (8.47 Bcf/d), slightly higher than in 2011 (Figure 12).
Figure 12 -Annual Canadian Natural Gas Consumption and Heating Degree Days (106m³/d and Heating degree days)
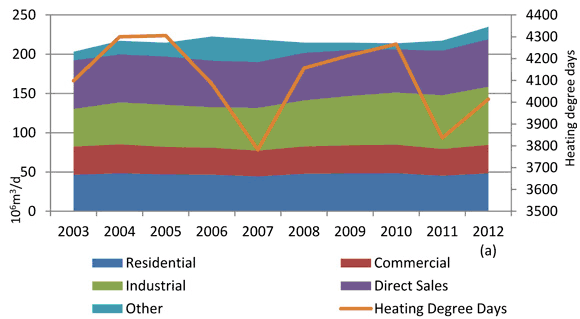
(a) Estimates
(b) Heating degree days (HDD) is an index calculated to reflect the demand for energy needed for heating homes, businesses, etc. HDD is the cumulative number of degrees in a year for which the mean temperature falls below 18.3 degrees C.
Sources: Statistics Canada, NEB estimates, and Canadian Gas Association
- Alberta oil sands operations use natural gas to generate electricity and steam. Steam is used for in situ oil production and in the production of hydrogen to upgrade bitumen into synthetic crude oil blends. Gas consumption by the oil sands in 2012 was estimated to be 66.4 106m³/d (2.36 Bcf/d), 9.9 per cent higher than in 2011 (Figure 13).
Figure 13 - Average Annual Purchased Natural Gas Requirements for Oil Sands Operations (106m³d and 109cf/d)
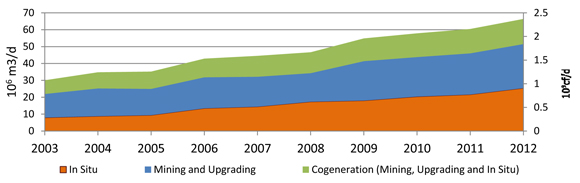
Sources: NEB, Alberta Energy Resources Conservation Board
Figure 14 - Canadian Marketable Natural Gas Production (109m³ and 106m³)
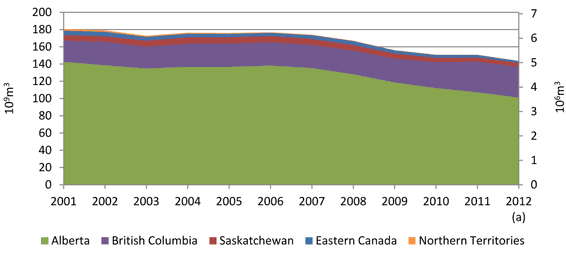
(a) Estimates
Sources: Governments of energy producing provinces and territories
- In 2012, Canadian gas production continued declining, falling to 144 109m³ (Figure 14) for the year and averaging 392.7 106m³/d (5.1 1012cf annual or 13.9 109cf/d) Gas production fell in all provinces and territories except in British Columbia. Gas prices were too low to cover the costs of adding new production except for a handful of plays, largely those whose economics were supplemented by the production of NGLs, which receive a higher price than dry gas. Estimated natural gas reserves to year-end 2011 are in Appendix 2.
- Gas production in British Columbia increased due to continued development of Montney tight gas, which is one of the lowest cost gas resources in Canada. British Columbia Montney averaged 44 106m³/d (1.6 Bcf/d) in 2012.
- Natural gas exports averaged 243.6 106m³/d (8.6 Bcf/d) in 2012, one per cent below 2011 exports of 246.5 106m³/d (8.7 Bcf/d). Pipeline imports in 2012 averaged slightly higher than in 2011. Liquefied natural gas (LNG) imports averaged 4.8 106m³/d (.17 Bcf/d), 47 per cent below 2011 imports of 9.1 106m³/d (.32 Bcf/d).
Figure 15 - Monthly Canadian Natural Gas Exports and Imports
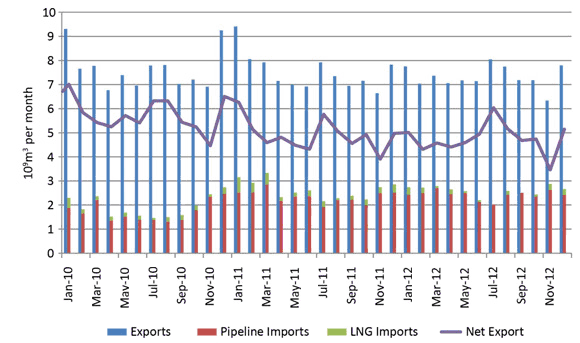
Source: NEB
Electricity
- Electricity generation grew by 1.6 per cent in 2012 to 645 TW.h (Table 5). About 900 MW of wind capacity was added in Canada in 2012, mostly in Quebec, Alberta and B.C. This brought wind capacity up to 6 195 MW and represented an 18 per cent increase over 2011.
Table 5 - Electricity Supply and Disposition (TW.h)
| 2008 | 2009 | 2010 | 2011 | 2012[a] | % Change (2011-2012) |
|
|---|---|---|---|---|---|---|
| Supply | ||||||
| Total Generation | 618.7 | 595.5 | 589.0 | 618.6 | 633 | 2.3 |
| Imports | 23.8 | 18.6 | 20.2 | 16.1 | 11.4 | -29.2 |
| Total Supply | 642.5 | 614.1 | 609.2 | 634.7 | 645 | 1.6 |
| Disposition | ||||||
| Demand | 586.0 | 560.8 | 563.6 | 581.9 | 586 | 0.7 |
| Exports | 56.5 | 53.3 | 45.6 | 52.8 | 58.5 | 10.8 |
| Total Disposition | 642.5 | 614.1 | 609.2 | 634.7 | 645 | 1.6 |
[a] Estimates
Sources:
2008 Statistics Canada 57-202, NEB
2009 to 2012: CanWEA, Statistics Canada 127-0003, NEB
- In Ontario, Units 1 and 2 of Bruce A Nuclear Station returned to service during fall 2012 adding 1 500 MW capacity to the province’s grid. In New Brunswick, the 680 MW Point Lepreau nuclear station was also refurbished and resumed operations in November. In Quebec, the new provincial government decided to close Gentilly 2, the only nuclear station in the province, citing high expected refurbishment costs as the deciding factor.
Table 6 - Electricity Generation (TW.h)
| 2008 | 2009 | 2010 | 2011 | 2012[a] | |
|---|---|---|---|---|---|
| Hydroelectric | 373.8 | 365.1 | 348.1 | 372.1 | 390 |
| Nuclear | 90.6 | 85.0 | 85.5 | 88.3 | 91 |
| Thermal | 150.5 | 136.9 | 142.8 | 145.3 | 137 |
| Wind, Tidal & Solar | 3.8 | 6.6 | 9.6 | 10.4 | 12 |
| Other | [b] | 1.9 | 3.0 | 2.5 | 2.5 |
| Total | 618.7 | 595.5 | 589.0 | 608.0 | 633 |
[a] Estimates
[b] Suppressed to meet confidentiality requirements of the Statistics Act
Sources: 2008 to 2012: Statistics Canada 127-0007; 2012: Statistics Canada 127-0002, CanWEA
Figure 16 - Canadian Residential Electricity Prices (cents per kW.h)
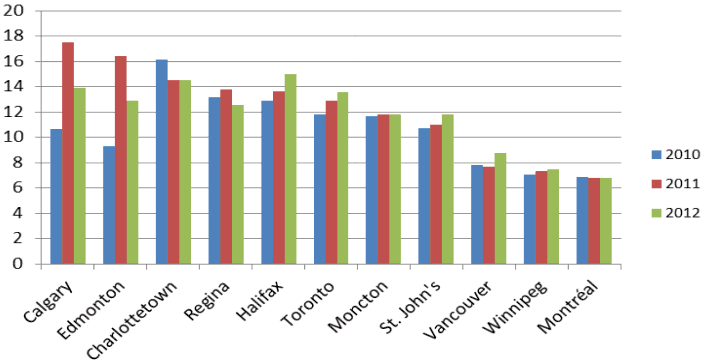
Sources: Hydro-Québec, based on 1 April rates in 2010, 2011 and 2012 and a monthly consumption of 1000 kW.h
Figure 17 - Wholesale, on Peak Monthly Average Electricity Prices, Alberta and Ontario ($ per MW.h)
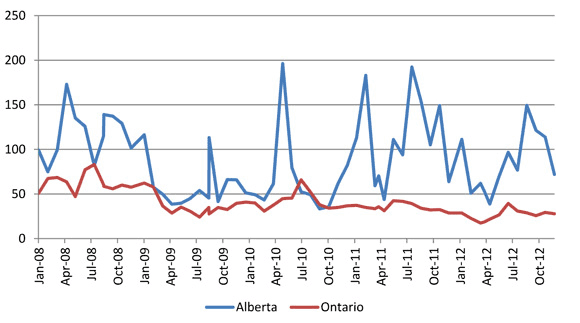
Note: The Ontario weighted average wholesale electricity price does not include the "global adjustment" which balances the rates paid to the regulated and contracted generators with their portions of the rates determined in the wholesale market.
Sources: Alberta Electric System Operator, Independent Electric System Operator of Ontario
- Electricity trade was at record levels in 2012. Exports increased to a 10-year high and imports fell to a 10-year low, driven by strong electricity sales in B.C., Ontario and Quebec (Figure 18). The high volume of trade did not translate into record earnings, however. Electricity prices in North American markets were relatively low in 2012 due to fairly weak economic growth and natural gas prices that were lower than in 2011. Net revenues for 2012 were only slightly higher than in 2011.
Figure 18 - Annual Electricity Exports and Imports
(TW.h)
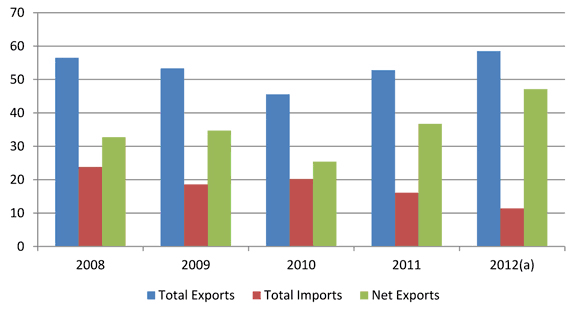
(a) Estimates
Source: NEB
Appendices
Appendix 1 - Canadian Oil Reserves[a] at 31 December 2011 (million cubic metres)
| Crude Oil Reserves | |||
|---|---|---|---|
| Initial Reserves |
Cumulative Production |
Remaining Established Reserves |
|
| Conventional Crude Oil | |||
| Light | |||
| British Columbia | 132 | 114 | 18 |
| Alberta | 2 475 | 2 296 | 178 |
| Saskatchewan | 275 | 262 | 13 |
| Manitoba | 53 | 47 | 5 |
| Subtotal - WCSB | 2 934 | 2 720 | 214 |
| Ontario | 15 | 13 | 2 |
| Nova Scotia Offshore | 7 | 7 | 0 |
| Newfoundland Grand Banks | 342 | 205 | 137 |
| Mainland NWT & Yukon | 53 | 43 | 10 |
| Arctic Islands | 1 | 1 | 0 |
| Subtotal - Frontier | 402 | 255 | 147 |
| Subtotal - Light | 3 351 | 2 988 | 363 |
| Heavy | |||
| Alberta | 389 | 321 | 68 |
| Saskatchewan | 661 | 582 | 79 |
| Subtotal - Heavy | 1 050 | 903 | 147 |
| Total - Conventional | 4 401 | 3 891 | 510 |
| Oil Sands | |||
| Mining Projects | 6 157 | 820 | 5 337 |
| In Situ Projects | 21 935 | 474 | 21 461 |
| Total - Oil Sands | 28 092 | 1 294 | 26 798 |
[a] Sources:
- Offshore Petroleum Board estimates of reserves for the East Coast offshore
- NEB for estimates of reserves in the Mainland Territories and Arctic Islands
- Alberta EUB Reserves Report & Supply & Demand Report 2012
- Saskatchewan Reservoir Annual 2008
- British Columbia Hydrocarbon and ByProducts Reserves 2010
- Manitoba Designated Oil Pools
- CAPP for Ontario
Appendix 2 - Canadian Natural Gas Reserves[a] at 31 December 2011 (billion cubic metres)
| Natural Gas Reserves | |||
|---|---|---|---|
| Initial Reserves |
Cumulative Production |
Remaining Established Reserves |
|
| Western Canadian Sedimentary Basin | |||
| British Columbia | 1 213 | 659 | 555 |
| Alberta | 5 384 | 4 377 | 1 007 |
| Saskatchewan | 266 | 207 | 59 |
| Total | 6 863 | 5 242 | 1 621 |
| Ontario | 54 | 36 | 18 |
| Frontier | |||
| New Brunswick | 4 | 1 | 3 |
| Nova Scotia Offshore | 55 | 50 | 5 |
| Mainland NWT & Yukon | 32 | 20 | 13 |
| Mackenzie Delta | 0 | 0 | 0 |
| Total | 92 | 71 | 22 |
| Total Canada (billion m³) | 7 009 | 5 349 | 1 660 |
[a] Note: Natural gas reserves are defined as the total amount of marketable gas in discovered pools that can be extracted in current economic conditions.
Source: NEB
Endnotes
[1] The public interest is inclusive of all Canadians and refers to a balance of economic, environmental, and social considerations that change as society's values and preferences evolve over time.
[2] Section 118 of the National Energy Board Act: On an application for a licence to export oil or gas, the Board shall satisfy itself that the quantity of oil or gas to be exported does not exceed the surplus remaining after due allowance has been made for the reasonably foreseeable requirements for use in Canada, having regard to the trends in the discovery of oil or gas in Canada.
[3] The American benchmark price.
[4] Bank of Canada, Monetary Policy Report, January 2013, p. 26.
[5] Amounts are in Canadian dollars unless otherwise specified.
[6] Henry Hub is the biggest natural gas hub in North America, where the continent’s benchmark natural gas price is established. It is the pricing point for natural gas futures contracts traded on the New York Mercantile Exchange (NYMEX). Henry Hub is located in the state of Louisiana at the interconnection of numerous intra and interstate natural gas pipelines.
[7] From Statistics Canada 228-0059, uranium not included
[8] As defined by Natural Resources Canada, energy used by final consumers for residential, agricultural, commercial, industrial and transportation purposes.
[9] Offshore Energy Technical Research Association, Play Fairway Analysis: A Study of Nova Scotia’s Offshore Basin, 2011.
[10] Western Canadian Select is a blend of Canadian heavy and bitumen crude oils with sweet synthetic and condensates.
[11] Bank of Canada, Monetary Policy Report, January 2013, p. 26.
- Date modified: