Market Snapshot: Managing nature can help reduce Canada’s greenhouse gas emissions
Connect/Contact Us
Please send comments, questions, or suggestions for Market Snapshot topics to snapshots@cer-rec.gc.ca
Release date: 2024-02-07
Nature-based climate solutions (NBCS) can play an important role in reducing greenhouse gas (GHG) emissions in Canada. NBCS are ways that humans protect, restore, or manage natural ecosystems that sequester carbon or reduce GHG releases to the atmosphere.Footnote 1 (Figure 1)
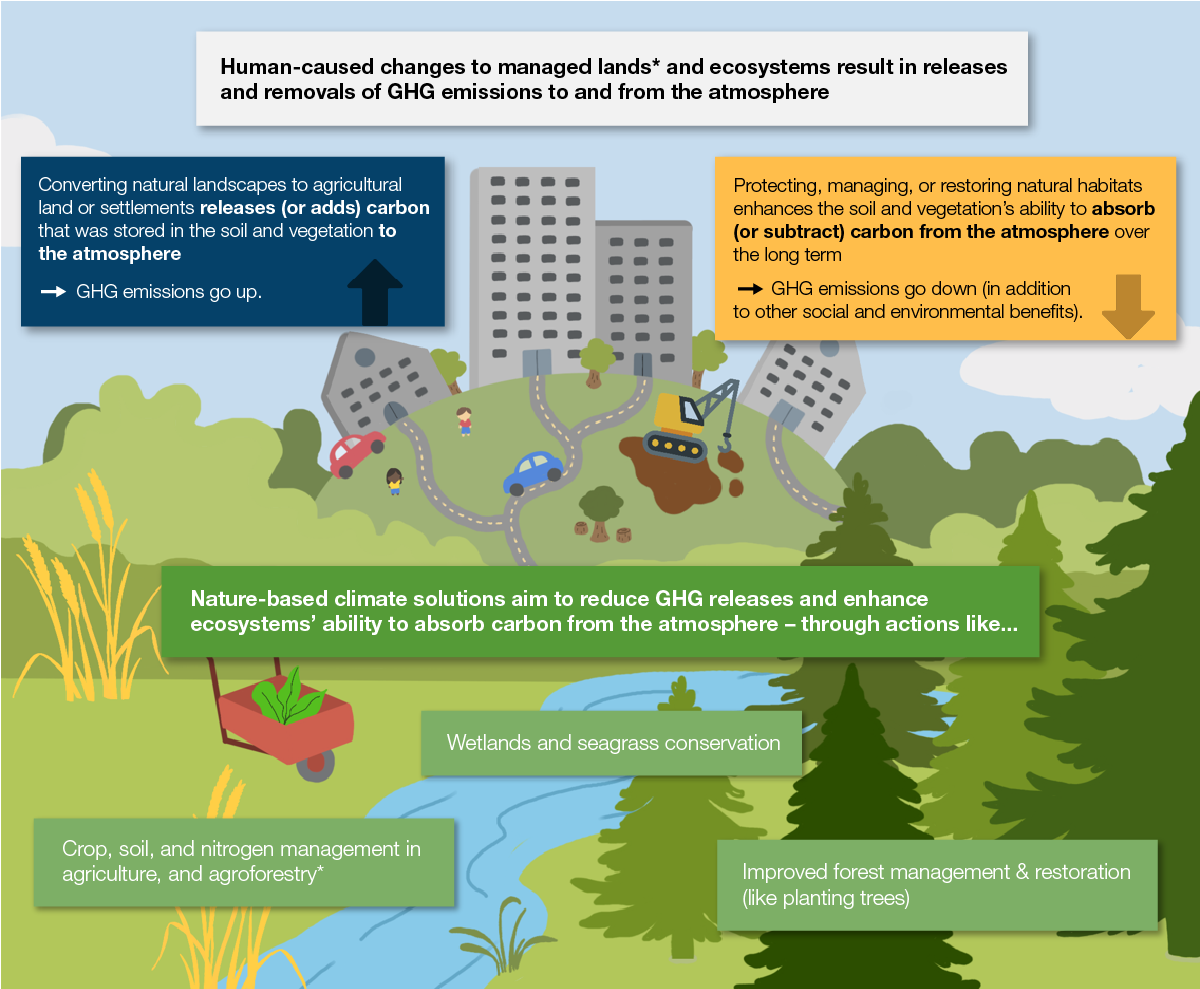
Figure 1: How do human-caused changes to nature impact GHG emissions?
Source and Description
Source: CER
Description: This is an infographic, at the top of it is an illustration of a hill with buildings on it, roadways, and cars, and also shows a construction site with a crane. The bottom shows a stream running through grassland and forests and there are 7 text boxes overlaying the illustration that read:
- Human-caused changes to managed landsDefinition* and ecosystems result in releases and removals of GHG emissions to and from the atmosphere.
- Converting natural landscapes to agricultural land or settlements releases (or adds) carbon that was stored in the soil and vegetation to the atmosphere -> GHG emissions go up.
- Protecting, managing, or restoring natural habitats enhances the soil and vegetation’s ability to absorb (or subtract) carbon from the atmosphere over the long term -> GHG emissions go down (in addition to other social and environmental benefits).
- Nature-based climate solutions aim to reduce GHG releases and enhance ecosystems’ ability to absorb carbon from the atmosphere – through actions like...
- Wetlands and seagrass conservation
- Crop, soil, and nitrogen management in agriculture, and agroforestry.Definition*
- Improved forest management & restoration (like planting trees).
In Canada’s GHG emissions inventory, the land-use, land-use change, and forestry (LULUCF) category accounts for emissions releases (+) and removals (-) from human-caused changes to managed lands – including from forestryDefinition*, agricultureDefinition*, wetlandsDefinition*, and settlementsDefinition*.
The total sum of LULUCF exchanges (i.e., releases and removals) from all six sources in Figure 2, fluctuates annually, but the trend over the last 2 decades has been a decline in net removals – from a peak of -68 megatonnes of carbon dioxide equivalent (Mt of CO2e) in 1991 to -17 Mt of CO2e in 2021. (Figure 2).
Forest lands,Footnote 2 harvested wood products (HWPs),Definition* and croplands are the largest contributors to LULUCF in Canada. Key factors contributed to LULUCF exchanges over the past 3 decades:
- Harvest levels and increases in natural disturbances, like insect infestation and wildfiresFootnote 3, reduced the stock of mature managed forest, resulting in a 35% decline in GHG removals from forest lands; from -203 Mt of CO2e in 1990 compared to -133 Mt of CO2e in 2021.
- Releases from HWPs – which peaked in 1995 at +154 Mt of CO2e and declined to +128 Mt of CO2e by 2021 – depend on the carbon stored in the harvested trees, as well as harvesting rates and the mix of long-lived vs. short-lived HWPs, both of which are impacted by industry/market conditions for forestry products.
- Improvements in agricultural management practices in Western Canada (including adoption of conservation tillageDefinition* and reduced use of summerfallowDefinition*) as well as higher crop yields, have increased agricultural soils’ carbon input, leading to increasing removals from croplands over time.
Figure 2: Canada’s LULUCF GHG releases (+) and removals (-) by category 1990-2021
Source and Description
Source: National Inventory Report 1990-2021: Greenhouse Gas Sources and Sinks in Canada
Description: This area chart shows Canada’s GHG releases (positive values) and removals (negative values), by source, for the land-use, land-use change, and forestry (LULUCF) category from 1990 to 2021 (most current available data). Total LULUCF exchanges in Canada have fluctuated from net removals of -68 Mt of CO2e in 1991, to net releases of +24 thousand tonnes of CO2e in 2015. For 2021, net LULUCF removals of -17 Mt of CO2e were estimated, equivalent to 3% of Canada’s total GHG emissions that year. Net removals from forestry have decreased over time, while net removals from agriculture have increased. The LULUCF category has consistently acted an emissions sink, however, there is a decreasing trend over time.
In Canada’s Energy Future 2023, we conservatively assume net LULUCF removals (including implementation of NBCS) of -13 Mt of CO2e for 2030-50 in the Current Measures scenario, and -30 and -50 Mt of CO2 by 2030 and 2050 (respectively) in our Net-zero scenarios. In both Net-zero scenarios, this is equivalent to around one-third of the total negative emissions needed to offset total remaining emissions of around +150 Mt of CO2e across other sectors of the economy to reach Net-zero emissions by 2050.
This illustrates the important role that NBCS can play in a Net-zero future in Canada. Examples of federal-level initiatives aimed at boosting the GHG emissions reduction potential of NBCS include the Government of Canada’s 2 billion tree (2BT) program, the Nature Smart Climate Solutions Fund, and the On-Farm Climate Action Fund.
Other experts are estimating the potential for NBCS in Canada
Interest in NBCS potential for reducing GHG emissions has increased in the last few years in the context of Canada’s commitment to reach Net-zero emissions by 2050. Generally, GHG emissions projections or NBCS assessments, quantify the emissions reduction potential from NBCS as net LULUCF removals (negative values).
Estimates from government, non-government organizations, and academia range from potential GHG removals from NBCS of as low as -12 and as high as -124 Mt of CO2e for 2030 (with a commonly used value of around -80 Mt of CO2e). The range for 2050 goes from -64 to -144 Mt of CO2e – with a commonly used value of around -100 Mt of CO2e for that year. However, some long term/undated estimates have values greater than -300 Mt.Footnote 4 (Figure 3)
Figure 3: Ranges for GHG emissions reduction potential from NBCS in Canada
Sources and Description
Sources: Council of Canadian Academies, 2022; Drever et. al., 2021; Environment and Climate Change Canada – Canada’s 8th national communication and 5th biennial report (Table 5-6, page 258); Environment and Climate Change Canada – Exploring approaches for Canada’s transition to Net-Zero emissions (Page 44); and Navius Research for Canadian Climate Institute – Achieving net zero emissions by 2050 in Canada
Description: This chart shows the potential for GHG removals from NBCS in Canada from the recent literature, for the years 2030 and 2050, in negative values and in Mt of CO2e. Three values are provided including a minimum and maximum estimate to illustrate the range, and a commonly used value for a given year.
A recent comprehensive assessment of NBCS’ GHG emissions reduction potential by the Council of Canadian Academies indicates -40 Mt of CO2e by 2030 to be a credible estimate of cost-effective mitigation.Footnote 5
- Date modified: