Market Snapshot: What is energy modelling, and how can it help inform Canada’s transition to net-zero emissions by 2050?
Connect/Contact Us
Please send comments, questions, or suggestions for Market Snapshot topics to snapshots@cer-rec.gc.ca
Release date: 2023-12-06
Energy modelling is a varied discipline that allows us to explore all aspects of energy systems. Energy accounts for over three-quarters of global greenhouse gas emissions,Footnote1 and we use it every day to move around, heat and cool our homes, and make the goods and materials we consume. With countries around the world, including Canada, committing to net-zero emissions by 2050, there is more focus now than ever on energy systems and their impact on the environment and society at large. Although energy modelling can be used for many purposes, it is an important tool to help explore possible pathways to a net-zero future while ensuring Canadians continue to have access to affordable energy for all their needs.
What are models?
Models are simplifications of reality. Aspects of the real world are represented through a series of mathematical relationships. The systems models represent can be incredibly complex – like the energy system – so they cannot be perfect representations of reality. Therefore, it is important to be aware of a model’s limitations. When modelling future energy systems, modellers must communicate that their results aren’t predictions of what will happen. Instead, they provide potential outcomes for the future under a specific set of assumptions, like the future cost of electric vehicles, the global price of oil and gas, and climate policies.
Why do we model?
It’s simple – our brains have limitations! Imagine all the impacts a policy like carbon pricing might have on the energy system. It isn’t easy to keep track of all the interactions and potential outcomes, but a model attempts to do exactly that. Whether examining the relationship between economic growth and energy demand or how a region’s energy mix changes over time under different levels of climate action – models are an essential tool for mapping out complex systems.
Net-zero is a new challenge for energy models
A net-zero energy system looks very different than the current one. To model net-zero, models must be able to address things like new and emerging energy markets, technology evolution, and changes to climate policy in both Canada and the rest of the world. In the Canada Energy Regulator’s (CER) Canada’s Energy Future 2023, for example, there are significant differences in the energy mix and emissions for the transportation system in two scenarios: Global Net-zero and Current Measures. (Figure 1)
Figure 1: Transportation energy mix and emissions in two scenarios in Canada’s Energy Future 2023
Source and Description
Source: Canada’s Energy Future 2023
Description: Canadian transportation energy mix and emissions under the Current Measures and Global Net-zero scenarios in the Canada’s Energy Future 2023 report. In Current Measures, total energy use stays relatively the same from 2021 to 2050. The energy mix changes, with fossil fuels making up ~95% of energy used for transportation in 2021 and declines to 85% by 2050, with the majority being replaced by bioenergy and electricity. In Current Measures, Transportation emissions decline after 2023 from 173 MtCO2e to 153 MtCO2e in 2050. In Global Net-zero, total energy use declines from 2,350 PJ in 2021 to 1,973 PJ by 2050. This decline is due to the efficiency gains from the adoption of electric vehicles. The energy mix changes substantially, with fossil fuels making up 95% of energy used for transportation in 2021 and declines to 12% by 2050. Electricity climbs from less than 1% of energy used in 2021 to 39% of energy used in 2050, hydrogen climbs from 0% in 2021 to 35% in 2050, and bioenergy climbs from 6% in 2021 to 14% in 2050. In Global Net-zero, emissions decline from 150 MtCO2e in 2021 to 15 MtCO2e in 2050.
Figure 1 highlights some of the many significant changes that will occur across Canada’s energy mix and emissions in a net-zero future. Thus, transparency on model assumptions and methodology is essential to communicating modelling results. Canada’s Energy Future 2023 incorporates transparency in three ways: with a chapter describing the scenarios and assumptions used in the modelling, an appendix tool, which allows users to download all the data outputs from the model in customized spreadsheets, and finally with a methodology appendix outlining the details of each model and how they interact.
Who’s modelling net-zero in Canada?
Academics, private industry, non-governmental organizations, think tanks, and all levels of government in Canada are beginning to model net-zero. The Net-Zero Advisory Body conducted interviews across a range of Canadian and international modellers in the summer of 2022 to identify areas of improvement for net-zero modelling. There were numerous recommendations, including improvements in access to data, coordination amongst modelling groups, and communication around model results.Footnote2
In the last two years, multiple modelling projects have been funded by the federal government to help forward net-zero modelling efforts and improve science-based decision-making:
- In 2022, Natural Resources Canada invested in the Energy Modelling Hub, whose mission is to connect policymakers with energy modelling communities to support timely and evidence-based policy decisions.Footnote3
- In 2023, the Government of Canada invested in three energy modelling projects that created or improved interactive energy dashboards that explore many different scenarios for Canada’s energy system.Footnote4
The interactive dashboards, along with Canada’s Energy Future 2023 visualization tool, are described in Table 1.
Table 1: Interactive dashboards that explore net-zero scenarios in Canada
| The Canada Energy Regulator Exploring Canada’s Energy Future 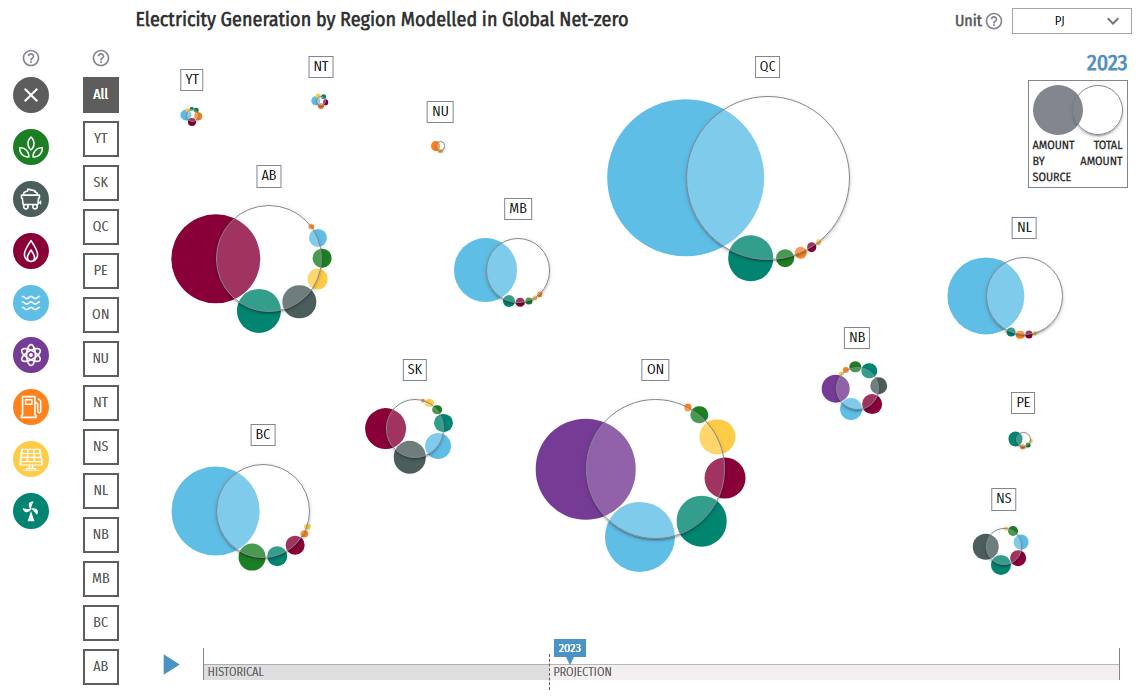
|
Exploring Canada’s Energy Future visualizes energy production, consumption, and emissions trends as modelled in both the current and past reports in the CER Energy Futures series. Scenarios differ in many ways, like technology costs, climate policies in Canada, and global oil and gas prices. |
| Institut de l’Énergie Trottier Pathways Explorer 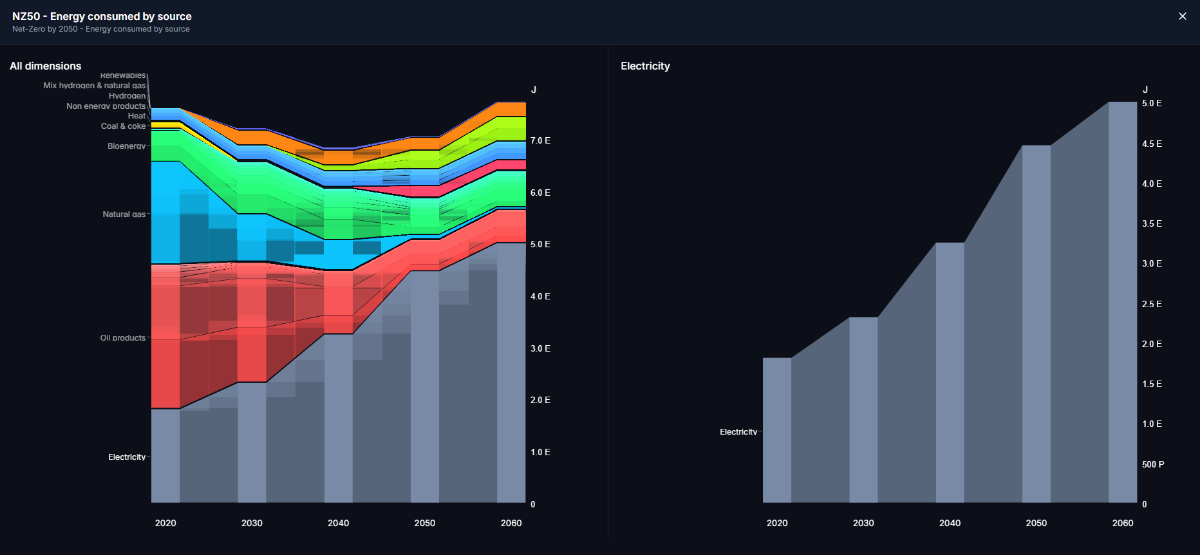
|
The Pathways Explorer compares many possible pathways for Canada to achieve net-zero emissions by 2050 under various constraints like technology availability, resource availability, and behavioural change. Detailed data on energy supply, demand, emissions, and investment is available. |
| Navius Research Canada Energy Dashboard 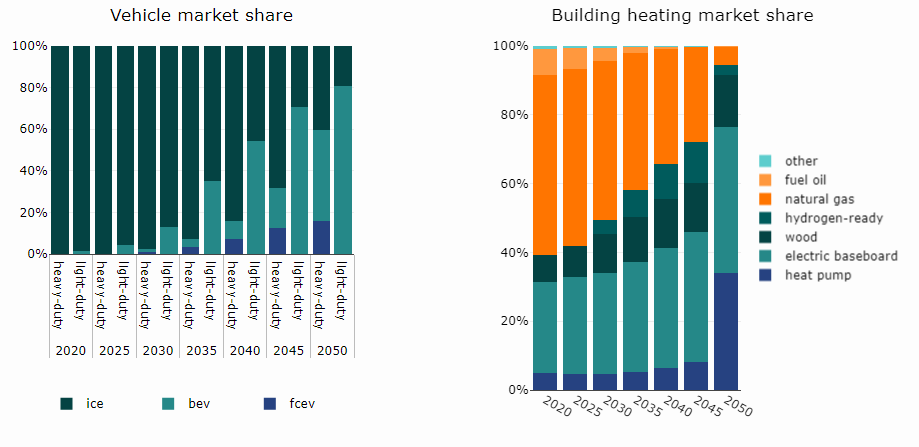
|
The Canada Energy Dashboard provides interactive access to energy, emissions, technology, and economic data from over 300 scenarios of Canada’s energy future. Scenarios differ in many ways, like technology costs and availability, climate policy, and the global oil price. |
| Pembina Institute Energy Policy Simulator 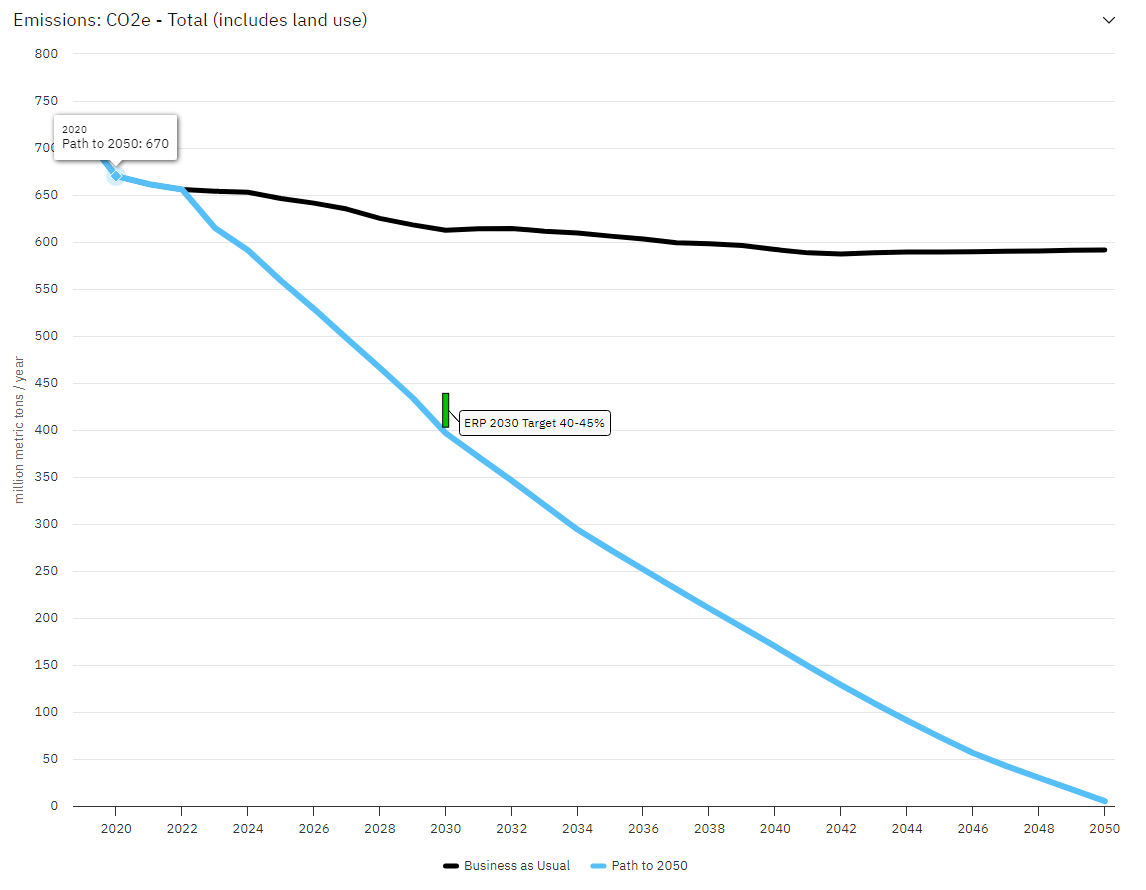
|
The Energy Policy Simulator aims to inform policymakers and regulators about which climate and energy policies will reduce greenhouse gas emissions and their impact on the energy system. All scenarios are related to the inclusion or exclusion of climate policy. |
- Date modified: