Market Snapshot: 50 years of Energy Futures
Release date: 2017-12-13
The recent release of Canada’s Energy Future 2017: Energy Supply and Demand Projections to 2040 (EF2017) marks 50 years since the National Energy Board (NEB) first began releasing comprehensive Canadian energy supply and demand outlooks. The original report, which was released in 1967 and produced an outlook to 1985, covered many issues in Canadian energy that are still relevant today. Similar to EF2017, the relationship between energy, the environment, and technology was prominent in the NEB’s 1967 outlook. Notable topics from the 1967 report included the future of electric vehicles and fuel cells, the role of emerging technologies in power generation (at that time, nuclear), and the future of the oil sands and offshore oil and gas.
The charts and images below provide some of the highlights of the NEB’s energy projection 50 years ago.
Just Like EF2017, the NEB’s 1967 Energy Supply and Demand Forecast
included a lot of discussion about future technologies.
Description
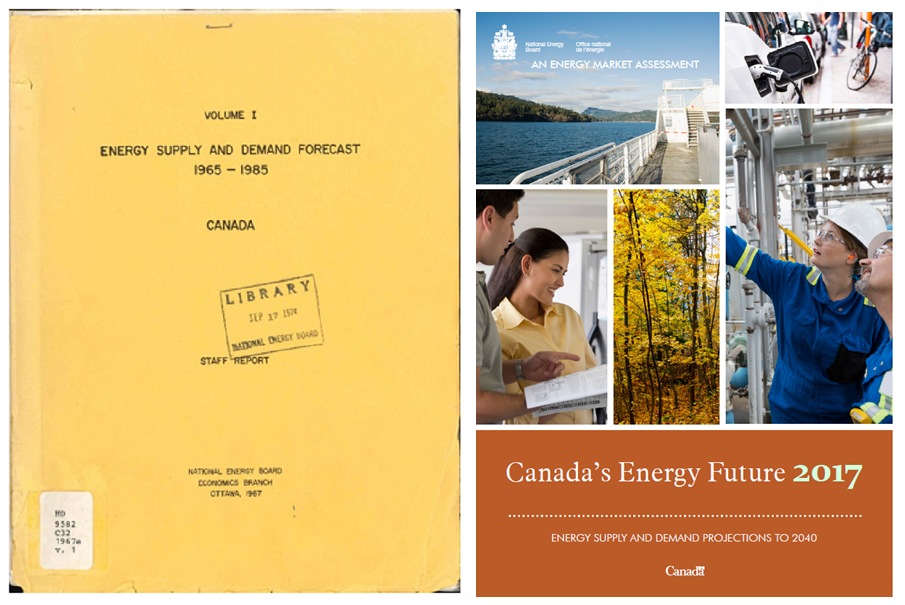
This photo shows the two front covers of the NEB forecasts: on the left, the simple typewritten cover from 1967 and on the right, the version from 2017 with photos of engineers, plug-in EVs, an LNG-fueled ferry, and a couple discussing energy efficient appliances.
One of the future technologies discussed in the 1967 report was electric vehicles. The ’67 Forecast on Electric Vehicles:
“Much has been said about the development of an electric car that would obviate the obnoxious fumes emitted by the internal combustion engine of the gasoline or diesel fuel operated car or truck, but immediate or practicable solutions do not appear on the nearby horizon.
The potential fraction of the transportation vehicle market which could be filled by electric-powered vehicles will depend to a large degree upon the buying habits of people in the multiple-car household market and upon the practical appeal of various mass transit schemes based on electric vehicles.
The conclusion is drawn that electric vehicles would probably establish themselves in the near future as a complement to the conventional vehicle, but it is assumed that over the next 20-year period there would be no significant displacement of the internal combustion engine in road vehicles.”
In 1967, production of synthetic crude from Athabasca Oil Sands commenced,
and future oil production scenarios were based on exploration activity.
Description
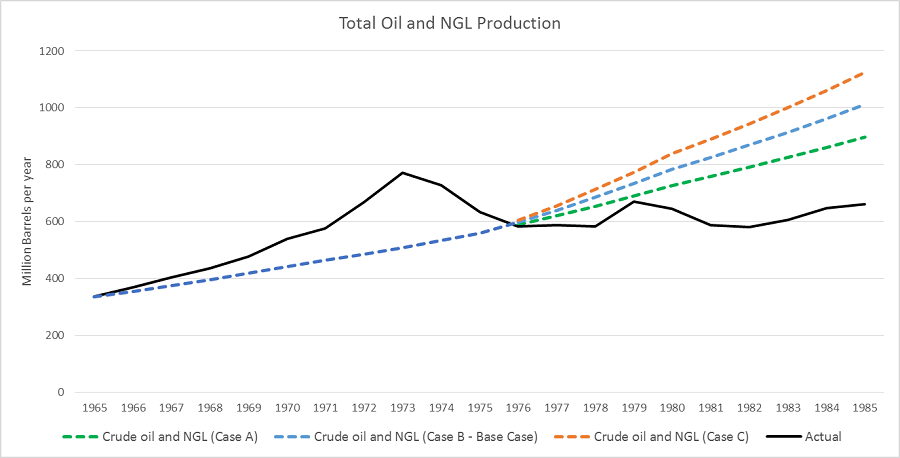
This graph compares Canadian actual oil and NGL production from 1965 to 1985 with the 1967 projection. The actual production data began in 1965 with 336 million barrels per year (MMb/y), which grew to 772 MMb/y by 1973, where it peaked. After 1973, production declined to 661 MMb/y by 1985. The 1967 outlook projected production to reach 509 MMb/y by 1973. After 1975, the 1967 report provided 3 separate cases for production growth. Case (A) increased from 558 MMb/y to 898 MMb/y, while Case (B) and (C) increased to 1 012 and 1 124 MMb/y, respectively.
The Great Canadian Oil Sands Ltd. plant became the first to produce synthetic crude oil from the Athabasca Oil Sands. Meanwhile, in-situ recovery techniques were under active research and development. In 1967, Alberta was operating under a policy that prioritized conventional oil sources and regulated oil sands production. The policy limited oil sands production to 5% of conventional production permitting increased production only as markets grew, and linked growth to the life-index of proven conventional oil reservesFootnote 1.
Assuming this policy would continue, the 1967 outlook projected offshore fields and additional conventional discoveries would drive Canada’s future reserves and productionFootnote 2. However, given this uncertainty, the report provided 3 cases for Canadian oil and natural gas liquids production:
(A) Exploration activity was held steady after 1967Footnote 3,
(B) Exploration activity steadily increased after 1967 until it reached 50% higher levels by 1985,
(C) Exploration activity steadily increased after 1967 until it reached 100% higher levels by 1985.
Actual production exceeded the 1967 outlook up until the mid 1970’s.
The report projected relatively fast growth for natural gas and refined petroleum products sales,
and was near target for much of the forecast period.
Description
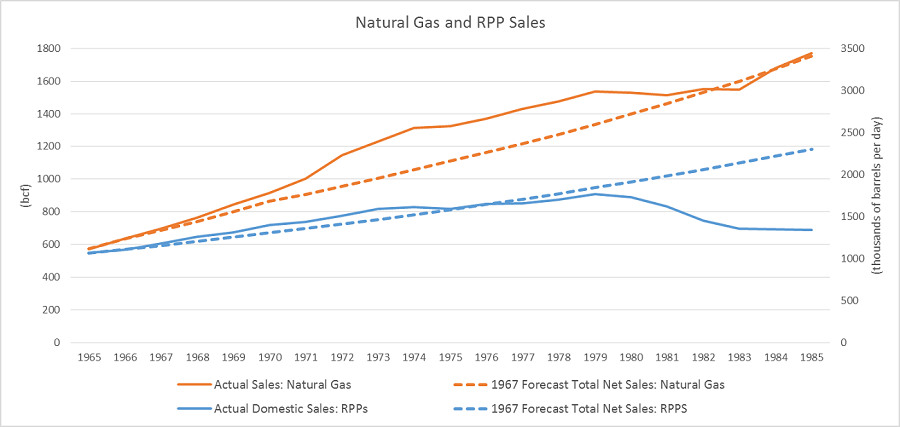
This graph compares actual Canadian natural gas and RPP sales to the 1967 projections. Sales of natural gas were projected to increase from 573 billion cubic feet (Bcf) in 1965, to 1 752.5 Bcf in 1985, while actual sales in 1985 were 1 770 Bcf. Sales of RPPs were projected to increase from 1 065 thousand barrels per day (Mb/d) in 1965 to 2 301 Mb/d in 1985. Actual sales of RPPs in 1985 were 1 339 Mb/d. However, the RPP sale projection aligned with the actual data until 1979. RPPs were projected to grow to 1 841 Mb/d by 1979, while actual data showed sales of 1 768 Mb/d. After 1979, actual sales declined from 1 768 Mb/d to 1 339 Mb/d in 1985.
Optimistic outlooks for Canadian population and gross national product (GNP) growth resulted in significant energy demand growth projectionsFootnote 4. Natural gas sales were projected to grow 5.75% annually from 1965 to 1985, and annual growth was actually 5.80%. Projected industrial sales for natural gas in 1985 were 2.2 billion cubic feet higher than 1985 recorded sales, which amounts to a 0.24% difference between the projection and actual 1985 sales. For comparison, the EF2017 Reference Case projected Canadian demand for natural gas will grow 0.89% annually from 2016 to 2040.
From 1965 to 1985, refined petroleum products were projected to grow 3.93% annually, while average annual growth was actually 1.12%. However, the disparity between the projection and actual trend emerges in the early 1980s, corresponding with record breaking global oil prices and Canada falling into an economic recession.
The future of Canadian utility generation was believed to be nuclear power,
but the report was a bit too optimistic.
Description
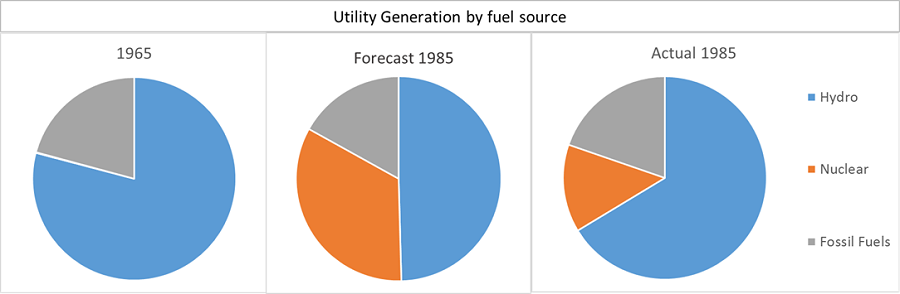
3 pie charts break down and compare Canadian electricity generation by source in 1965, to the 1967 projection for 1985, and the actual 1985 generation shares. In 1965, electricity generation consisted of 79% hydro, and 21% fossil fuels. The forecast for 1985 was that electricity generation would consist of 50% hydro, 33% nuclear, and 17% fossil fuels. In 1985 electricity generation actually consisted of 66% hydro, 14% nuclear, and 20% fossil fuels.
Two key factors drove projections for increased nuclear power. First, the costs of nuclear electricity generation were expected to match or fall below other conventional sources. Second, pressure to decrease fossil fuel emissions provided nuclear generation an opportunity to meet growing Canadian demand. Adoption of nuclear generation was most prominent in Ontario, where the ’67 Forecast projected it would provide 58.5% of utility generation by 1985. In 1985 nuclear actually provided 14% of generation in Canada, up from .28% in 1965.
The ’67 Forecast discussion about pollution and the electricity mix said:
“In general, this study assumes that social pressure to reduce air pollution may have the effect of perhaps slowing somewhat the growth of oil consumption for industrial uses, including power generation, and inhibiting the use of coal. Correspondingly, it is assumed that generation of electric power from nuclear plants and the use of gas will be stimulated.”
The future of Canadian coal production was significantly underestimated.
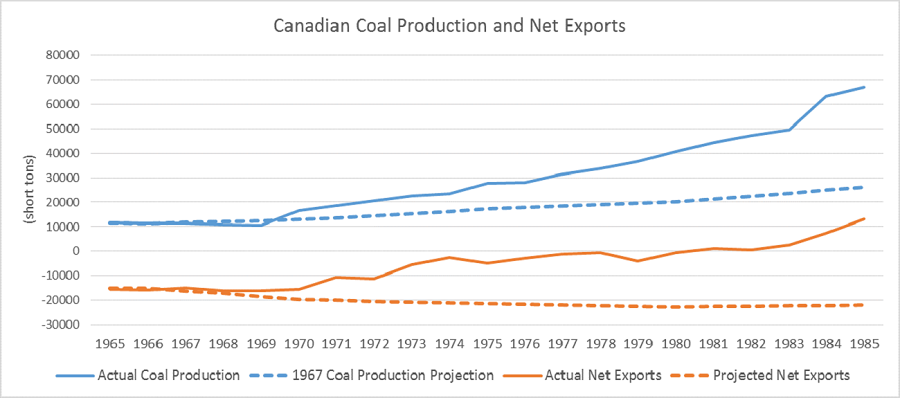
Description
This graph compares Canadian coal production and net exports in the 1967 outlook to actual data. Coal production was projected to increase from 11 588 short tonnes (st) in 1965, to 26 200 st in 1985, while production actually grew to 66 889 st in 1985. In the 1967 outlook, coal imports were expected to exceed exports and this negative balance for net exports was expected to increase from -15 050 st in 1965, to -21 895 st in 1985. Canadian coal exports actually started to increase in the early 1970s, and in 1981, net exports became positive. By 1985, Canada was exporting more coal that it was importing and net exports reached 13 017 st.
The 1967 report expected coal imports to continue to exceed exports with the deficit growing from -15 000 tons in 1966, to just under -22 000 tons by 1985. However, in 1981, Canadian coal exports surpassed imports, and by 1985, Canada exported 13 000 st more than it imported.
- Date modified: